

Distribution of non-phosphorylated neurofilament in squirrel monkey V1 is complementary to the pattern of cytochrome-oxidase blobs
- PMID: 12816887
- PMCID: PMC2646847
- DOI: 10.1093/cercor/13.7.722
Distribution of non-phosphorylated neurofilament in squirrel monkey V1 is complementary to the pattern of cytochrome-oxidase blobs
Abstract
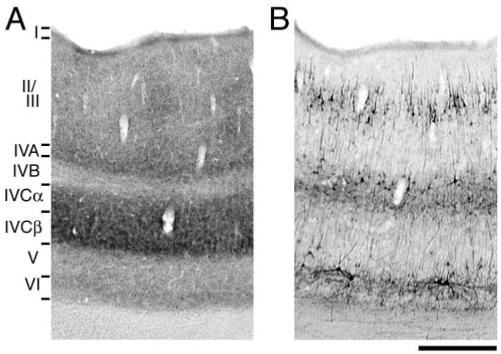
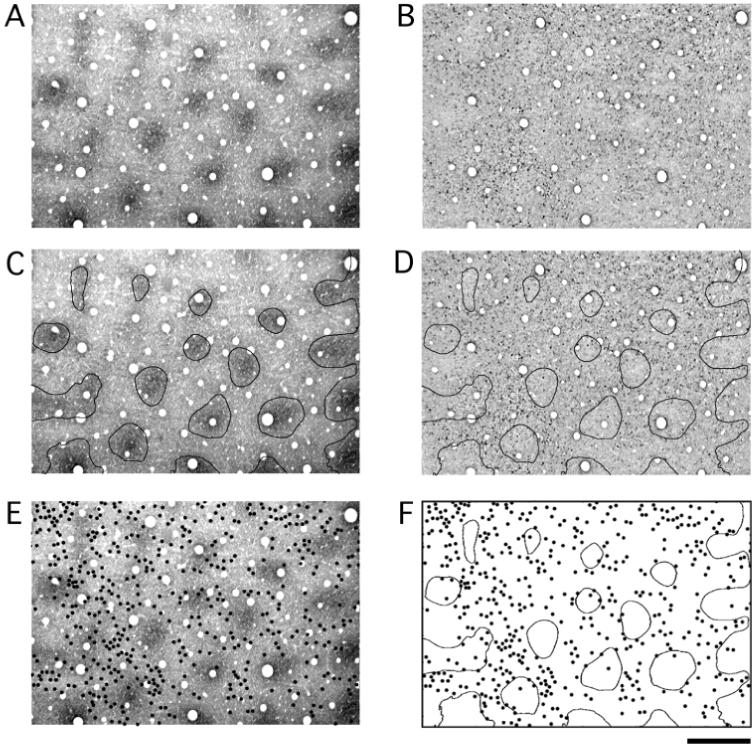
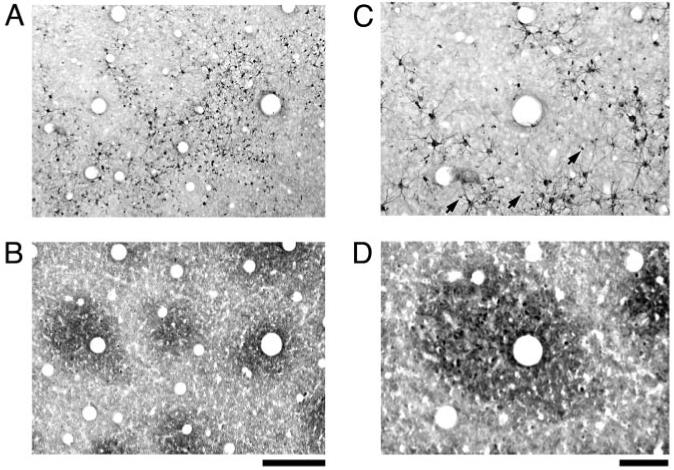
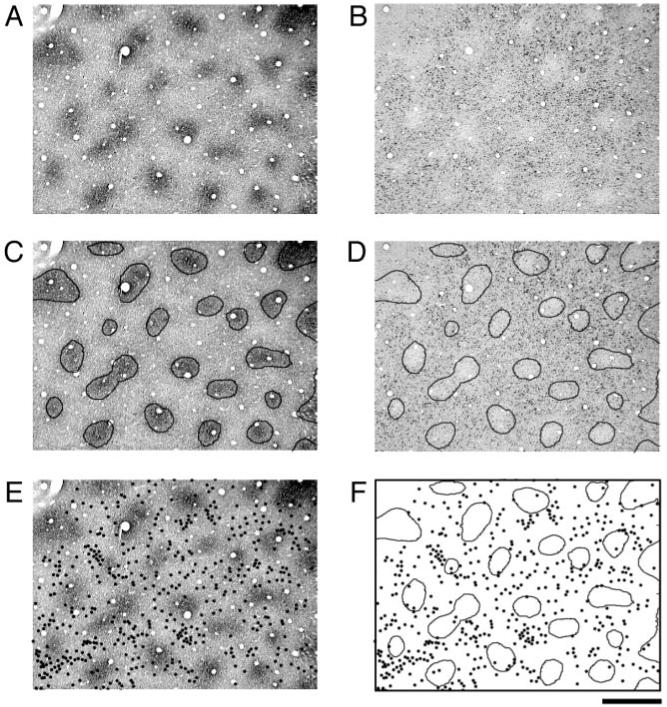
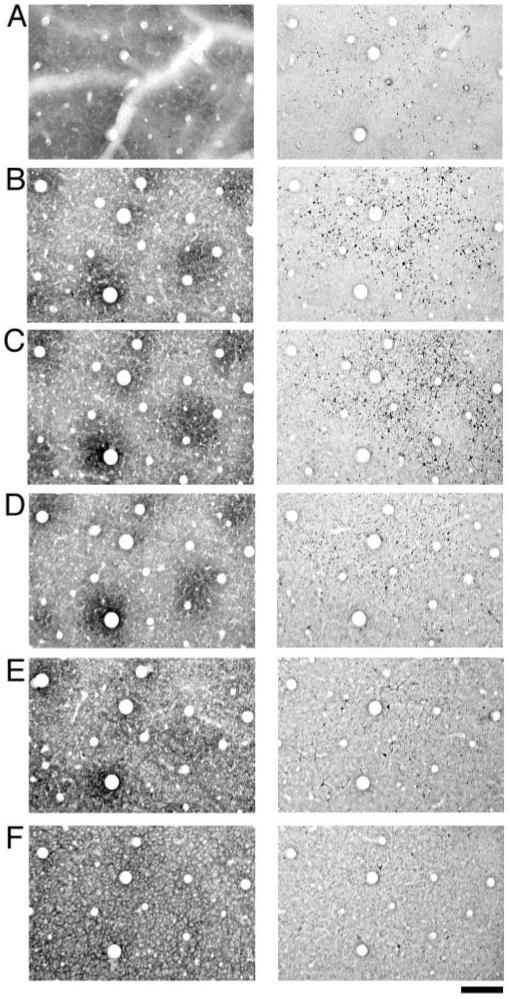
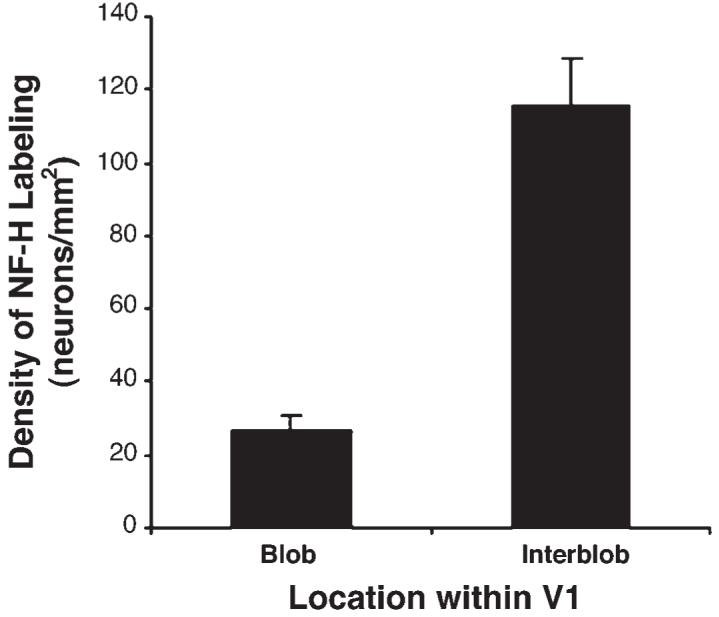
The geniculo-recipient zones of the primate primary visual cortex (V1) stain more strongly for cytochrome oxidase (CO) than other regions. Labeling V1 with an antibody (SMI-32) against neurofilament protein produces a laminar pattern that is largely complementary to that of CO: the layers that receive the strongest geniculate input react weakly for SMI-32. We evaluated whether the complementary laminar relationship extends throughout the superficial layers where there are regularly spaced blobs of dark CO staining that are known to receive geniculate input. In all hemispheres, neurofilament labeling in the superficial layers was indeed complementary to the CO pattern. The density of SMI-32 labeled neurons was quantified and found to be greater within the CO interblobs than in the blobs. These results demonstrate that blobs and interblobs can be distinguished by examining the pattern of neurofilament expression in V1. That neurofilament expression is highest within interblobs raises the possibility that the distribution of cell types may be non-uniform across blobs and interblobs.
Figures
Similar articles
-
Cytochrome-oxidase blobs and intrinsic horizontal connections of layer 2/3 pyramidal neurons in primate V1.Vis Neurosci. 1998 Nov-Dec;15(6):1007-27. doi: 10.1017/s0952523898156018. Vis Neurosci. 1998. PMID: 9839966
-
Cytochrome oxidase and neurofilament reactivity in monocularly deprived human primary visual cortex.Cereb Cortex. 2007 Jun;17(6):1283-91. doi: 10.1093/cercor/bhl038. Epub 2006 Jul 10. Cereb Cortex. 2007. PMID: 16831856 Free PMC article.
-
Relationships between cytochrome oxidase (CO) blobs in primate primary visual cortex (V1) and the distribution of neurons projecting to the middle temporal area (MT).J Comp Neurol. 1999 Jul 12;409(4):573-91. doi: 10.1002/(sici)1096-9861(19990712)409:4<573::aid-cne5>3.0.co;2-r. J Comp Neurol. 1999. PMID: 10376741
-
Cytochrome oxidase "blobs": a call for more anatomy.Brain Struct Funct. 2021 Dec;226(9):2793-2806. doi: 10.1007/s00429-021-02360-2. Epub 2021 Aug 12. Brain Struct Funct. 2021. PMID: 34382115 Free PMC article. Review.
-
Cytochrome oxidase 'blobs' and other characteristics of primary visual cortex in a lemuroid primate, Cheirogaleus medius.Brain Behav Evol. 1996;47(2):103-12. doi: 10.1159/000113231. Brain Behav Evol. 1996. PMID: 8866707 Review.
Cited by
-
Areas of cat auditory cortex as defined by neurofilament proteins expressing SMI-32.Hear Res. 2010 Aug;267(1-2):119-36. doi: 10.1016/j.heares.2010.04.003. Epub 2010 Apr 27. Hear Res. 2010. PMID: 20430082 Free PMC article.
-
Co-localization of glutamic acid decarboxylase and vesicular GABA transporter in cytochrome oxidase patches of macaque striate cortex.Vis Neurosci. 2015;32:E026. doi: 10.1017/S0952523815000218. Vis Neurosci. 2015. PMID: 26579566 Free PMC article.
-
Loss of neurofilament labeling in the primary visual cortex of monocularly deprived monkeys.Cereb Cortex. 2005 Aug;15(8):1146-54. doi: 10.1093/cercor/bhh214. Epub 2004 Nov 24. Cereb Cortex. 2005. PMID: 15563721 Free PMC article.
-
The cortical column: a structure without a function.Philos Trans R Soc Lond B Biol Sci. 2005 Apr 29;360(1456):837-62. doi: 10.1098/rstb.2005.1623. Philos Trans R Soc Lond B Biol Sci. 2005. PMID: 15937015 Free PMC article. Review.
-
Inferotemporal face patches are histo-architectonically distinct.Cell Rep. 2024 Sep 24;43(9):114732. doi: 10.1016/j.celrep.2024.114732. Epub 2024 Sep 12. Cell Rep. 2024. PMID: 39269905 Free PMC article.
References
-
- Blumcke I, Weruaga E, Kasas S, Hendrickson AE, Celio MR. Discrete reduction patterns of parvalbumin and calbindin D-28k immunoreactivity in the dorsal lateral geniculate nucleus and the striate cortex of adult macaque monkeys after monocular enucleation. Vis Neurosci. 1994;11:1–11. - PubMed
-
- Carroll EW, Wong-Riley MT. Quantitative light and electron microscopic analysis of cytochrome oxidase-rich zones in the striate cortex of the squirrel monkey. J Comp Neurol. 1984;222:1–17. - PubMed
-
- Celio MR, Scharer L, Morrison JH, Norman AW, Bloom FE. Calbindin immunoreactivity alternates with cytochrome c-oxidase-rich zones in some layers of the primate visual cortex. Nature. 1986;323:715–717. - PubMed
-
- Chaudhuri A, Zangenehpour S, Matsubara JA, Cynader MS. Differential expression of neurofilament protein in the visual system of the vervet monkey. Brain Res. 1996;709:17–26. - PubMed
