

doi: 10.1128/IAI.71.7.4206-4211.2003.
Mutation of sarA in Staphylococcus aureus limits biofilm formation
Affiliations
- PMID: 12819120
- PMCID: PMC161964
- DOI: 10.1128/IAI.71.7.4206-4211.2003
Item in Clipboard
Mutation of sarA in Staphylococcus aureus limits biofilm formation
Infect Immun.
2003 Jul.
Abstract
Mutation of sarA resulted in a reduced capacity to form a biofilm in six of the eight Staphylococcus aureus strains we tested (UAMS-1, UAMS-601, SA113, SC-01, S6C, and DB). The exceptions were Newman, which formed a poor biofilm under all conditions, and RN6390, which consistently formed a biofilm only after mutation of agr. Mutation of agr in other strains had little impact on biofilm formation. In every strain other than Newman, including RN6390, simultaneous mutation of sarA and agr resulted in a phenotype like that observed with the sarA mutants. Complementation studies using a sarA clone confirmed that the defect in biofilm formation was due to the sarA mutation.
Figures
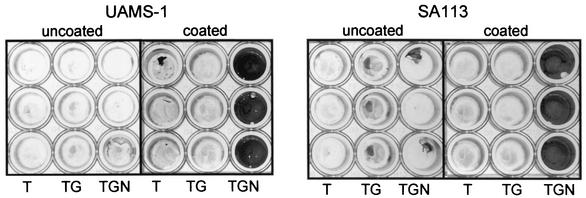
UAMS-1 biofilm formation in vitro. The S. aureus strains UAMS-1 and SA113 (ATCC 35556) were grown in TSB without supplements (T) or supplemented with glucose (TG) or glucose and sodium chloride (TGN). Overnight cultures were diluted 1:200 in fresh medium and incubated in the wells of a microtiter plate with (coated) or without (uncoated) precoating with plasma proteins. Plates were processed as described in the text.
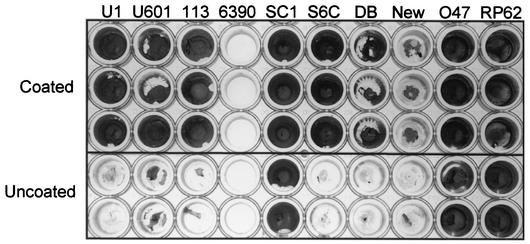
Biofilm formation by other staphylococcal strains. All strains were grown in TSB supplemented with both glucose and sodium chloride. The top three rows of cultures were precoated with plasma proteins. The bottom two rows were left uncoated. S. aureus strains included UAMS-1 (U1), UAMS-601 (U601), SA113 (113), RN6390 (6390), SC-01 (SC1), DB, and Newman (New); O47 and RP62A (RP62) are biofilm-positive S. epidermidis strains that were included as controls.
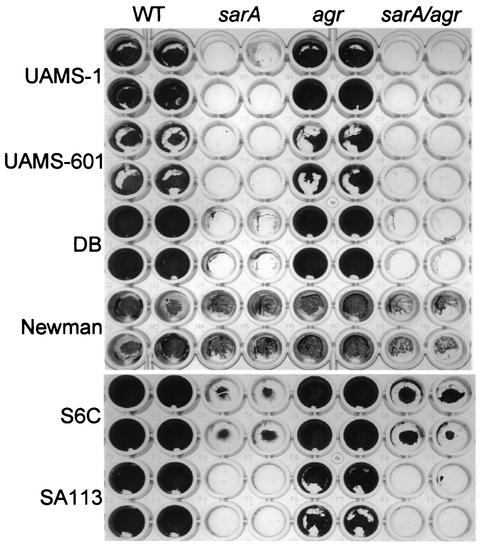
Biofilm formation in S. aureus sarA and agr mutants. Wild-type (WT) S. aureus strains are identified on the left side of the figure. Specific mutations introduced into each strain are indicated at the top. All strains were grown in TSB supplemented with both glucose and sodium chloride. Biofilm assays were done using precoated plates.
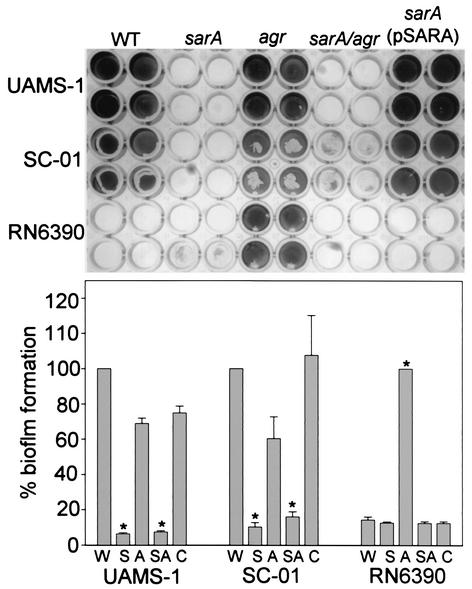
Complementation of sarA defect. Top panel: wild-type (WT) strains are identified on the left side of the figure. Specific mutations introduced into each strain are indicated at the top. All strains were grown in TSB supplemented with both glucose and sodium chloride. Biofilm assays were done using precoated plates. Complementation of the sarA mutants was done with a plasmid containing the P1 promoter and sarA ORF (3). Bottom panel: quantitative analysis of biofilm formation was done by spectrophotometric analysis. In the case of strains UAMS-1 and SC-01, results for the sarA mutant (S), the agr mutant (A), the sarA/agr double mutant (SA), and the pSARA-complemented sarA mutant (C) are shown relative to those for the wild-type strain (W). In the case of RN6390, results are shown relative to those of the agr mutant. Asterisks denote statistical significance (P < 0.05) on the basis of the analysis of five plates, with each plate containing wells that were duplicates of those shown in the upper panel. Statistical comparisons were done using Kruskal-Wallis one-way analysis of variance.
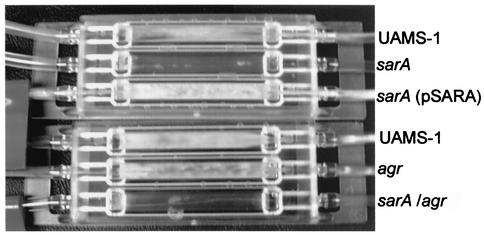
Flow cell analysis of strain UAMS-1 mutants. Flow cells were inoculated with the indicated strain (right side of figure) and incubated for 24 h at a flow rate that replaced the volume of the flow cell every minute.
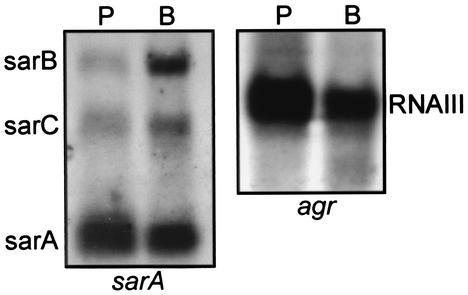
Northern blot analysis. RNA was isolated from strain UAMS-1 grown to stationary phase (15 h) in planktonic culture (P) or from 1-week-old biofilms generated in a flow cell (B). Equal amounts of RNA (based on A260/A280 ratios) were resolved by agarose electrophoresis and hybridized with probes corresponding to sarA (left panel) or agr (right panel). The specific identity of each transcript is indicated beside each panel.
References
-
- Arvidson, S., and K. Tegmark. 2001. Regulation of virulence determinants in Staphylococcus aureus. Int. J. Med. Microbiol. 291:159-170. - PubMed
Publication types
MeSH terms
Substances
Grants and funding
LinkOut - more resources
Full Text Sources
Other Literature Sources
Molecular Biology Databases
Miscellaneous
