

Targeting a complex transcriptome: the construction of the mouse full-length cDNA encyclopedia
- PMID: 12819125
- PMCID: PMC403712
- DOI: 10.1101/gr.1119703
Targeting a complex transcriptome: the construction of the mouse full-length cDNA encyclopedia
Abstract
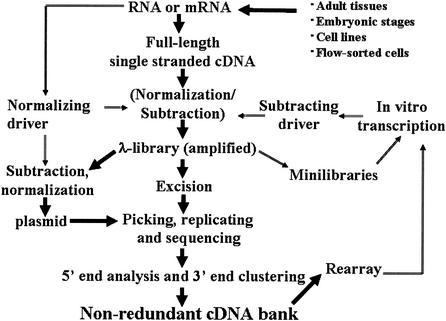
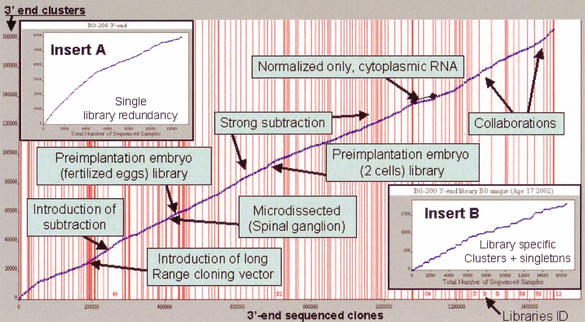
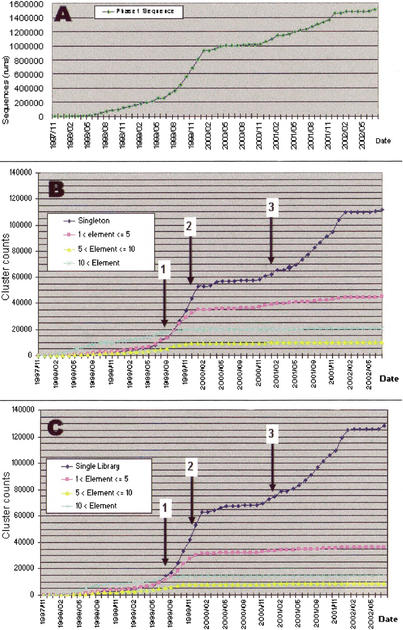
We report the construction of the mouse full-length cDNA encyclopedia,the most extensive view of a complex transcriptome,on the basis of preparing and sequencing 246 libraries. Before cloning,cDNAs were enriched in full-length by Cap-Trapper,and in most cases,aggressively subtracted/normalized. We have produced 1,442,236 successful 3'-end sequences clustered into 171,144 groups, from which 60,770 clones were fully sequenced cDNAs annotated in the FANTOM-2 annotation. We have also produced 547,149 5' end reads,which clustered into 124,258 groups. Altogether, these cDNAs were further grouped in 70,000 transcriptional units (TU),which represent the best coverage of a transcriptome so far. By monitoring the extent of normalization/subtraction, we define the tentative equivalent coverage (TEC),which was estimated to be equivalent to >12,000,000 ESTs derived from standard libraries. High coverage explains discrepancies between the very large numbers of clusters (and TUs) of this project,which also include non-protein-coding RNAs,and the lower gene number estimation of genome annotations. Altogether,5'-end clusters identify regions that are potential promoters for 8637 known genes and 5'-end clusters suggest the presence of almost 63,000 transcriptional starting points. An estimate of the frequency of polyadenylation signals suggests that at least half of the singletons in the EST set represent real mRNAs. Clones accounting for about half of the predicted TUs await further sequencing. The continued high-discovery rate suggests that the task of transcriptome discovery is not yet complete.
Figures
References
-
- Adams, M.D., Kelley, J.M., Gocayne, J.D., Dubnick, M., Polymeropoulos, M.H., Xiao, H., Merril, C.R., Wu, A., Olde, B., Moreno, R.F., et al. 1991. Complementary DNA sequencing: Expressed sequence tags and human genome project. Science 252: 1651-1656. - PubMed
-
- Adams, M.D., Kerlavage, A.R., Fleischmann, R.D., Fuldner, R.A., Bult, C.J., Lee, N.H., Kirkness, E.F., Weinstock, K.G., Gocayne, J.D., White, O., et al. 1995. Initial assessment of human gene diversity and expression patterns based upon 83 million nucleotides of cDNA sequence. Nature 377: 3-174. - PubMed
-
- Aparicio, S.A. 2000. How to count... human genes. Nat. Genet. 25: 129-130. - PubMed
-
- Bashiardes, S. and Lovett, M. 2001. cDNA detection and analysis. Curr. Opin. Chem. Biol. 5: 15-20. - PubMed
WEB SITE REFERENCES
-
- http://genome.gsc.riken.go.jp/; Describes the overall activity of The RIKEN GER Group.
-
- http://www.informatics.jax.org/menus/expression_menu.shtml; Introduces the mouse tissue's classification.
-
- http://genome.gsc.riken.go.jp/READ/; Describes the microarray expression database of the RIKEN GER Group.
Publication types
MeSH terms
Substances
LinkOut - more resources
Full Text Sources
Other Literature Sources
Molecular Biology Databases
Research Materials
Miscellaneous