. 2003 Jun;13(6B):1324-34.
doi: 10.1101/gr.982903.

Antisense transcripts with FANTOM2 clone set and their implications for gene regulation

Affiliations

Antisense transcripts with FANTOM2 clone set and their implications for gene regulation

Hidenori Kiyosawa et al. Genome Res. 2003 Jun.

Abstract

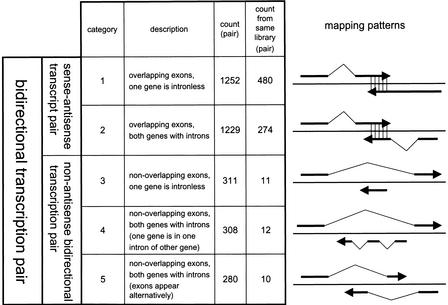
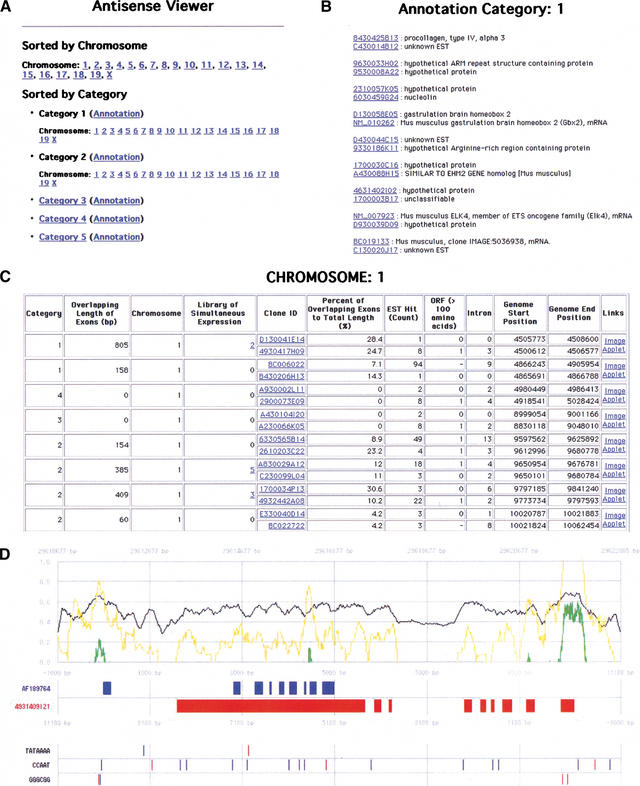
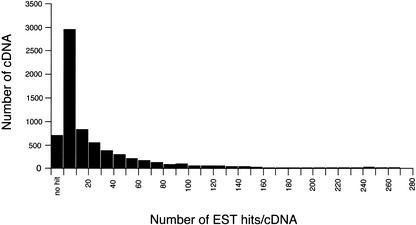
We have used the FANTOM2 mouse cDNA set (60,770 clones), public mRNA data, and mouse genome sequence data to identify 2481 pairs of sense-antisense transcripts and 899 further pairs of nonantisense bidirectional transcription based upon genomic mapping. The analysis greatly expands the number of known examples of sense-antisense transcript and nonantisense bidirectional transcription pairs in mammals. The FANTOM2 cDNA set appears to contain substantially large numbers of noncoding transcripts suitable for antisense transcript analysis. The average proportion of loci encoding sense-antisense transcript and nonantisense bidirectional transcription pairs on autosomes was 15.1 and 5.4%, respectively. Those on the X chromosome were 6.3 and 4.2%, respectively. Sense-antisense transcript pairs, rather than nonantisense bidirectional transcription pairs, may be less prevalent on the X chromosome, possibly due to X chromosome inactivation. Sense and antisense transcripts tended to be isolated from the same libraries, where nonantisense bidirectional transcription pairs were not apparently coregulated. The existence of large numbers of natural antisense transcripts implies that the regulation of gene expression by antisense transcripts is more common that previously recognized. The viewer showing mapping patterns of sense-antisense transcript pairs and nonantisense bidirectional transcription pairs on the genome and other related statistical data is available on our Web site.


Figures

Figure 1
Figure 1
Classification of sense–antisense transcript and nonantisense bidirectional transcription pair patterns. Five categories of bidirectional transcription patterns are shown. The categories are classified according to the patterns of how the two transcripts are mapped on the genome sequences. The schematic examples from each category are shown next to each explanation. Total pair counts as well as pair counts that are from the same cDNA library sources for each category are presented.
Figure 2
Figure 2
Histogram of overlapping length distribution. The distribution of sense–antisense transcript pairs for their overlapping length of exons is shown. The horizontal axis represents overlapping length (bp) of exons for each sense–antisense transcript pair. The vertical axis represents the number of pair for each bin.
Figure 3
Figure 3
Chromosome map of sense-antisense transcript and nonantisense bidirectional transcription pairs. All of the mapped positions of the bidirectional transcription pairs are schematically presented. The sense-antisense transcript and nonantisense bidirectional transcription pairs are presented in green on the left and in blue on the right, respectively. The red lines indicate the positions of the known imprinted genes. The pink areas are the regions ± 5 Mb of the known imprinted gene positions. Note that there are a few mapped positions of the sense-antisense transcripts on the X chromosome, compared with the autosomes. The names of known imprinted genes mapped in each pink region are: Wt1 (1); Nnat (2); Gnas, Gnasxl, Nespas (3); p73 (4); Sgce (5); Copg2, Mit1/Ib9 (6); Peg3/Pw1, Usp29, Zim1, Zim3, Zfp264 (7); Frat3, GABRA5, GABRB3, GABRG3, Magel2, Mkrn3/Zfp127, Ndn, Snrpn, Snurf, Ube3a (8); H19, Igf2, Igf2as, Ins2, Ipl/Tssc3, Kvlqt1, Mash2, Nap1l4, Obph1, p57KIP2/Cdkn1c, Slc22a1l, Tapa1/Cd81, Tssc4 (9); Rasgrf1 (10); Zac1 (11); Dcn (12); Meg1/Grb10 (13); U2af1-rs1 region1, U2af1-rs1 region2 (14); Dlk, Meg3/Gtl2 (15); Htr2a (16); Ata3 (17); Igf2r, Mas1, Slc22a2, Slc22a3 (18); Impact (19); Ins1 (20). Because the genes on the X chromosome are imprinted only on the paternal X chromosome in the extraembryonic tissues (reviewed by Latham 1996), we did not shade the X chromosome with pink color. Although the chromosomal locations of Ipw, Kvlqt1-as, Msuit, Peg1/Mest, and Pwcr1 are already known, these genes were not computationally mapped by BLAST program. Accordingly, these genes are not shown in Figure 3.
Figure 4
Figure 4
Examples of antisense viewer. All data of the bidirectional transcription pairs can be viewed at http://genome.gsc.riken.go.jp/m/antisense/viewer/. (A) Entrance of the viewer. The data are either sorted by chromosome or category. By clicking “Annotation,” the FANTOM2 annotation of each cDNA (B) will be shown. By clicking chromosome numbers or category numbers, the pages for the description of the bidirectional transcription pairs will be shown (C). (B) Gene names by FANTOM annotation are shown for each sense–antisense cDNA pairs. (C) Data for each bidirectional transcription pair are shown. By clicking either “Image” or “Applet,” graphical mapping patterns of cDNA on the genome sequences (D) will be presented. (D) Mapping patterns of bidirectional transcription cDNA pairs on the genome. Forward and reverse directions on the chromosomes are represented in blue and red colors, respectively. The filled boxes represent the positions of exons. The black line represents GC content along the genome sequences. The yellow and green lines represent a ratio of the observed to expected CpG score, and a final CpG score, respectively (please see the Methods section for a detailed calculation of these scores). The positions of major promoter consensus sequences are shown underneath the positions of exons.
Figure 5
Figure 5
Histogram of number of EST hits distribution. The distribution of bidirectional transcription pair cDNA for the number of EST hits is shown. The horizontal axis represents the number of EST hits for each bidirectional transcription pair cDNA. The vertical axis represents the number of cDNA for each bin. We also analyzed distributions for sense–antisense transcript pairs and nonantisense bidirectional transcription pairs separately, but there was no significant difference between these distributions (data not shown).

Similar articles

Cited by

References

    1. Albrecht, U., Sutcliffe, J.S., Cattanach, B.M., Beechey, C.V., Armstrong, D., Eichele, G., and Beaudet, A.L. 1997. Imprinted expression of the murine Angelman syndrome gene, Ube3a, in hippocampal and Purkinje neurons. Nat. Genet. 17: 75-78. - PubMed
    1. Altschul, S.F., Gish, W., Miller, W., Myers, E.W., and Lipman, D.J. 1990. Basic local alignment search tool. J. Mol. Biol. 215: 403-410. - PubMed
    1. Andria, M.L., Hsieh, C.L., Oren, R., Francke, U., and Levy, S. 1991. Genomic organization and chromosomal localization of the TAPA-1 gene. Immunology 147: 1030-1036. - PubMed
    1. Aravin, A.A., Naumova, N.M., Tulin, A.V., Vagin, V.V., Rozovsky, Y.M., and Gvozdev, V.A. 2001. Double-stranded RNA-mediated silencing of genomic tandem repeats and transposable elements in the D. melanogaster germline. Curr. Biol. 11: 1017-1027. - PubMed
    1. Argaman, L., Hershberg, R., Vogel, J., Bejerano, G., Wagner, E.G., Margalit, H., and Altuvia, S. 2001. Novel small RNA-encoding genes in the intergenic regions of Escherichia coli. Curr. Biol. 11: 941-950. - PubMed

WEB SITE REFERENCES

    1. http://fantom2.gsc.riken.go.jp/db/; FANTOM2 database Web site.
    1. http://ftp.genome.washington.edu/RM/RepeatMasker.html; RepeatMasker Web site.
    1. http://genome.gsc.riken.go.jp/m/antisense/; Entrance of the data for this article.
    1. http://genome.gsc.riken.go.jp/m/antisense/imprinted_genes/; list of sense–antisense transcript/transcription mapped +/- 5Mb region of known imprinted genes.
    1. http://genome.gsc.riken.go.jp/m/antisense/viewer/; Entrance of antisense viewer of this article.

Publication types

LinkOut - more resources