

Speed of visual processing increases with eccentricity
- PMID: 12819786
- PMCID: PMC3077107
- DOI: 10.1038/nn1079
Speed of visual processing increases with eccentricity
Erratum in
- Nat Neurosci. 2003 Aug;6(8):899
Abstract
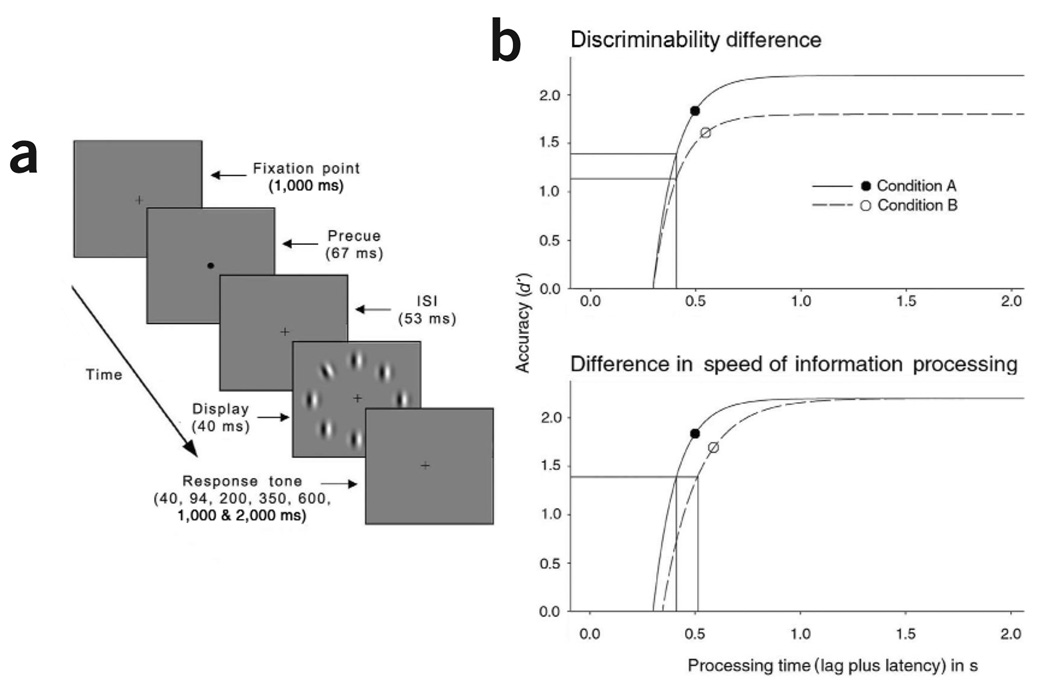
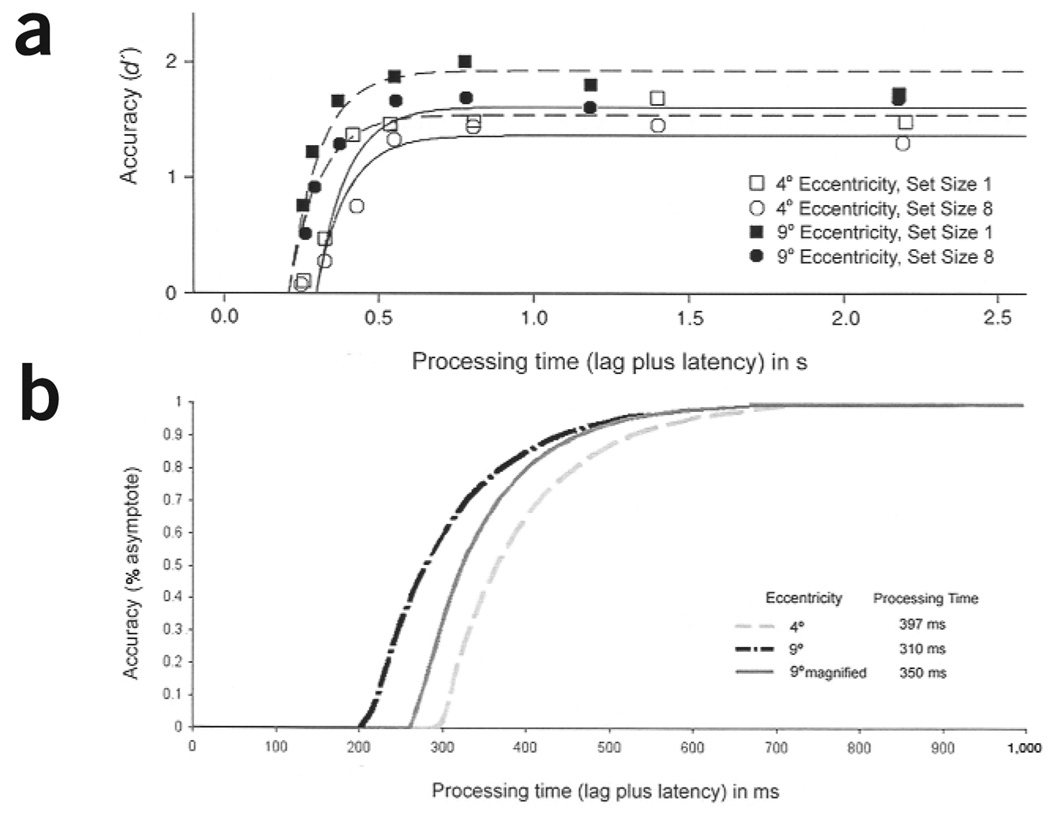
The visual system has a duplex design to meet conflicting environmental demands: the fovea has the resolution required to process fine spatial information, but the periphery is more sensitive to temporal properties. To investigate whether the periphery's sensitivity is partly due to the speed with which information is processed, we measured the full timecourse of visual information processing by deriving joint measures of discriminability and speed, and found that speed of information processing varies with eccentricity: processing was faster when same-size stimuli appeared at 9 degrees than 4 degrees eccentricity, and this difference was attenuated when the 9 degrees stimuli were magnified to equate cortical representation size. At the same eccentricity, larger stimuli are processed more slowly. These temporal differences are greater than expected from neurophysiological constraints.
Figures
Similar articles
-
The detection of motion in the peripheral visual field.Vision Res. 1984;24(1):25-32. doi: 10.1016/0042-6989(84)90140-8. Vision Res. 1984. PMID: 6695503
-
Speed change detection in foveal and peripheral vision.Vision Res. 2012 Nov 1;72:1-13. doi: 10.1016/j.visres.2012.08.019. Epub 2012 Sep 13. Vision Res. 2012. PMID: 22982685
-
A visual field dependent architecture for second order motion processing.Neurosci Lett. 2011 Oct 3;503(2):77-82. doi: 10.1016/j.neulet.2011.07.052. Epub 2011 Aug 6. Neurosci Lett. 2011. PMID: 21843594
-
Spatial and temporal frequency tuning in striate cortex: functional uniformity and specializations related to receptive field eccentricity.Eur J Neurosci. 2010 Mar;31(6):1043-62. doi: 10.1111/j.1460-9568.2010.07118.x. Epub 2010 Mar 3. Eur J Neurosci. 2010. PMID: 20377618
-
Motion perception in the peripheral visual field.Perception. 1982;11(4):457-62. doi: 10.1068/p110457. Perception. 1982. PMID: 6763677 Review.
Cited by
-
The dynamics of saliency-driven and goal-driven visual selection as a function of eccentricity.J Vis. 2021 Mar 1;21(3):2. doi: 10.1167/jov.21.3.2. J Vis. 2021. PMID: 33651878 Free PMC article.
-
Perceptual consequences of visual performance fields: the case of the line motion illusion.J Vis. 2009 Apr 17;9(4):13.1-17. doi: 10.1167/9.4.13. J Vis. 2009. PMID: 19757922 Free PMC article.
-
The influence of a moving object's location on object identity judgments.J Exp Psychol Hum Percept Perform. 2025 Jun;51(6):764-780. doi: 10.1037/xhp0001311. Epub 2025 Mar 27. J Exp Psychol Hum Percept Perform. 2025. PMID: 40146595
-
Eccentricity effects in vision and attention.Neuropsychologia. 2016 Nov;92:69-78. doi: 10.1016/j.neuropsychologia.2016.06.020. Epub 2016 Jun 21. Neuropsychologia. 2016. PMID: 27342258 Free PMC article.
-
Late Development of Early Visual Perception: No Topology-Priority in Peripheral Vision Until Age 10.Child Dev. 2021 Sep;92(5):1906-1918. doi: 10.1111/cdev.13629. Child Dev. 2021. PMID: 34569057 Free PMC article.
References
-
- DeValois RL, DeValois KK. Spatial Vision. New York: Oxford Univ. Press; 1988.
-
- Hartmann E, Lachenmayr B, Brettel H. Vision Res. 1979;19:1019–1023. - PubMed
-
- McKee SP, Nakayama K. Vision Res. 1984;24:25–32. - PubMed
-
- Lennie P. Perception. 1998;27:889–935. - PubMed
-
- Schmolesky MT, et al. Neurophysiology. 1998;79:3272–3278. - PubMed
Publication types
MeSH terms
Grants and funding
LinkOut - more resources
Full Text Sources
