. 2003 Jul;47(7):2118-24.
doi: 10.1128/AAC.47.7.2118-2124.2003.

Pharmacokinetics-pharmacodynamics of rifampin in an aerosol infection model of tuberculosis

Affiliations

Pharmacokinetics-pharmacodynamics of rifampin in an aerosol infection model of tuberculosis

Ramesh Jayaram et al. Antimicrob Agents Chemother. 2003 Jul.

Abstract

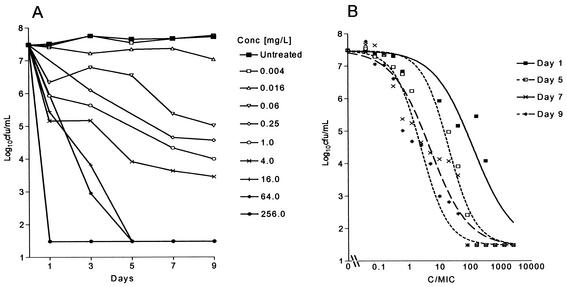
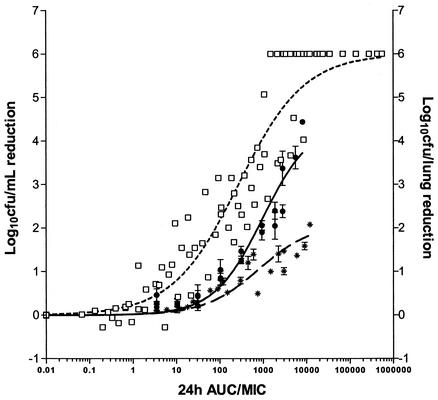
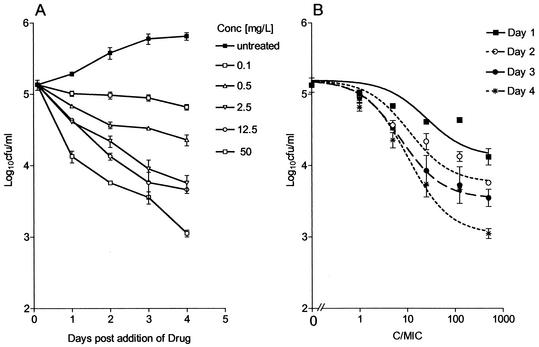
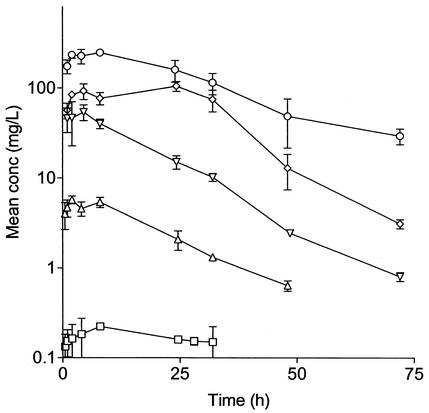
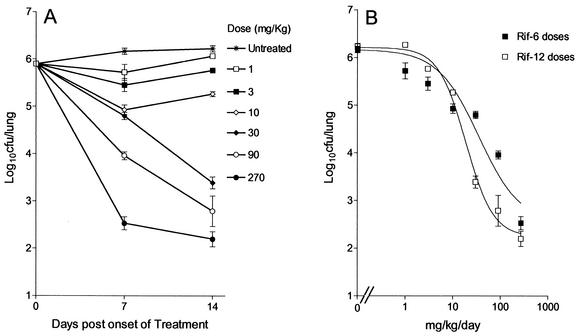
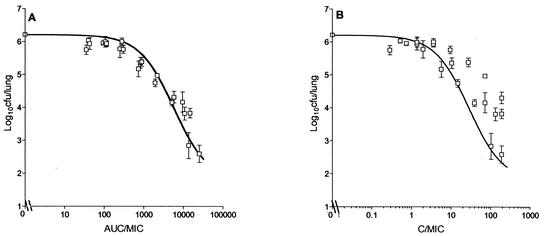
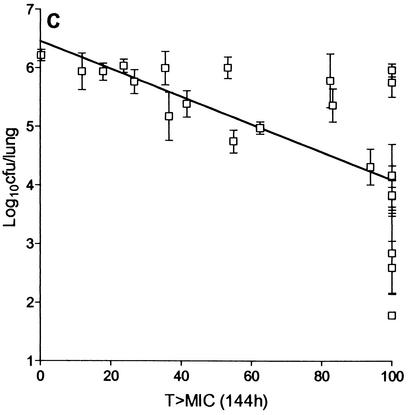
Limited information exists on the pharmacokinetic (PK)-pharmacodynamic (PD) relationships of drugs against Mycobacterium tuberculosis. Our aim was to identify the PK-PD parameter that best describes the efficacy of rifampin on the basis of in vitro and PK properties. Consistent with 83.8% protein binding by equilibrium dialysis, the rifampin MIC for M. tuberculosis strain H37Rv rose from 0.1 in a serum-free system to 1.0 mg/ml when it was tested in the presence of 50% serum. In time-kill studies, rifampin exhibited area under the concentration-time curve (AUC)-dependent killing in vitro, with maximal killing seen on all days and with the potency increasing steadily over a 9-day exposure period. MIC and time-kill studies performed with intracellular organisms in a macrophage monolayer model yielded similar results. By use of a murine aerosol infection model with dose ranging and dose fractionation over 6 days, the PD parameter that best correlated with a reduction in bacterial counts was found to be AUC/MIC (r(2) = 0.95), whereas the maximum concentration in serum/MIC (r(2) = 0.86) and the time that the concentration remained above the MIC (r(2) = 0.44) showed lesser degrees of correlation.


Figures

FIG. 1.
FIG. 1.
(A) Growth of M. tuberculosis in BACTEC 7H12B broth following exposure to increasing concentrations of rifampin. (B) Effect of increasing Cmax/MIC ratios on the bactericidal activity of rifampin on days 1 (r2 = 0.899), 5 (r2 = 0.963), 7 (r2 = 0.946), and 9 (r2 = 0.898) after the addition of drug. Each point represents the mean of duplicate values. The bactericidal effect is calculated on the basis of the initial inoculum prior to the addition of rifampin.
FIG. 2.
FIG. 2.
Comparison of the magnitude of AUC24/MIC for the bactericidal effect of rifampin in vitro (□), in infected macrophage monolayers (∗), or in vivo (•) following 4 to 6 days of exposure. AUC/MIC is defined as follows: (C × T)/MIC in broth for the in vitro and macrophage studies and AUC24/MIC in serum for the in vivo studies.
FIG. 3.
FIG. 3.
(A) Course of infection in the J774A.1 murine macrophage cell line following exposure to increasing concentrations of rifampin. Drug was added at 2 h postinfection. (B) Effects of increasing Cmax/MIC ratios on the intracellular bactericidal activity of rifampin against M. tuberculosis in the J774A.1 murine macrophage cell line on days 1 (r2 = 0.898), 2 (r2 = 0.969), 3 (r2 = 0.998), and 4 (r2 = 0.973) after the addition of drug. Each point represents the mean ± standard deviation of triplicate values. The bactericidal effect is calculated on the basis of the initial inoculum prior to addition of rifampin.
FIG. 4.
FIG. 4.
Single-dose concentration-versus-time PK profiles for incremental oral rifampin doses of 0.33 (□), 10 (▵), 90 (▿), 270 (⋄), and 810 (○) mg/kg in uninfected male BALB/c mice. Error bars indicate standard deviations.
FIG. 5.
FIG. 5.
(A) Course of infection from the onset of treatment with increasing doses of rifampin; (B) relationship between the total dose and the log10 CFU per lung (mean ± standard deviation). Mice were dosed once daily for either 6 days (Rif-6; r2 = 0.949) or 12 days (Rif-12; r2 = 0.985).
FIG. 6.
FIG. 6.
Relationship between AUC24/MIC (A), Cmax/MIC (B), and T > MIC (C) of rifampin and log10 CFU per lung of M. tuberculosis (mean ± standard deviation) when the total dose was given as one, three, or six equally divided doses over 144 h.
FIG. 6.
FIG. 6.
Relationship between AUC24/MIC (A), Cmax/MIC (B), and T > MIC (C) of rifampin and log10 CFU per lung of M. tuberculosis (mean ± standard deviation) when the total dose was given as one, three, or six equally divided doses over 144 h.

Similar articles

Cited by

References

    1. Acocella, G., N. A. Carlone, A. M. Cuffini, and G. Cavallo. 1985. The penetration of rifampicin, pyrazinamide, and pyrazinoic acid into mouse macrophages. Am. Rev. Respir. Dis. 132:1268-1273. - PubMed
    1. Andes, D., and W. A. Craig. 1998. In vivo activities of amoxicillin and amoxicillin-clavulanate against Streptococcus pneumoniae: application to breakpoint determination. Antimicrob. Agents Chemother. 42:2375-2379. - PMC - PubMed
    1. Armitige, L. Y., C. Jagannath, A. R. Wanger, and S. J. Norris. 2000. Disruption of the genes encoding antigen 85A and antigen 85B of Mycobacterium tuberculosis H37Rv: effect on growth in culture and in macrophages. Infect. Immun. 68:767-778. - PMC - PubMed
    1. Brooks, J. V., and I. M. Orme. 1998. Evaluation of once-weekly therapy for tuberculosis using isoniazid plus rifamycins in the mouse aerosol infection model. Antimicrob. Agents Chemother. 42:3047-3048. - PMC - PubMed
    1. Burman, W. J. 1997. The value of in vitro drug activity and pharmacokinetics in predicting the effectiveness of antimycobacterial therapy: a critical review. Am. J. Med. Sci. 31:355-363. - PubMed