

Quantitative analysis of gentamicin, azithromycin, telithromycin, ciprofloxacin, moxifloxacin, and oritavancin (LY333328) activities against intracellular Staphylococcus aureus in mouse J774 macrophages
- PMID: 12821480
- PMCID: PMC161849
- DOI: 10.1128/AAC.47.7.2283-2292.2003
Quantitative analysis of gentamicin, azithromycin, telithromycin, ciprofloxacin, moxifloxacin, and oritavancin (LY333328) activities against intracellular Staphylococcus aureus in mouse J774 macrophages
Abstract
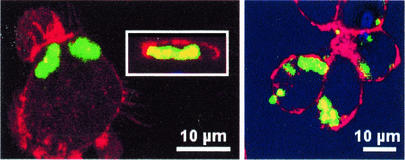
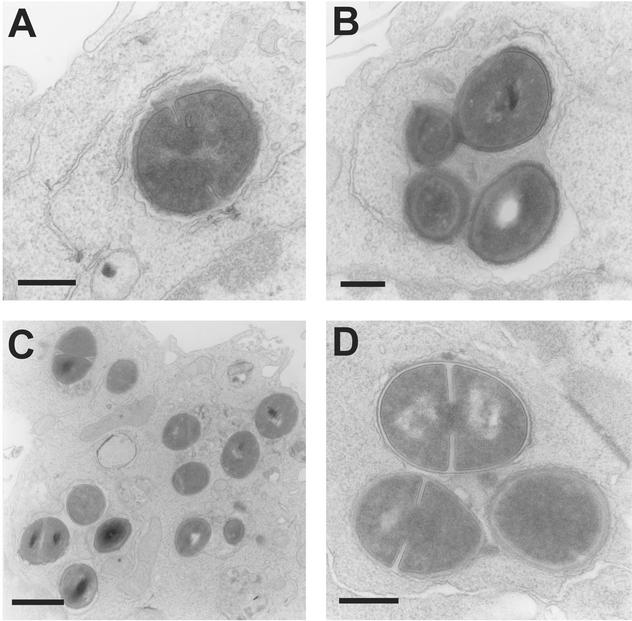
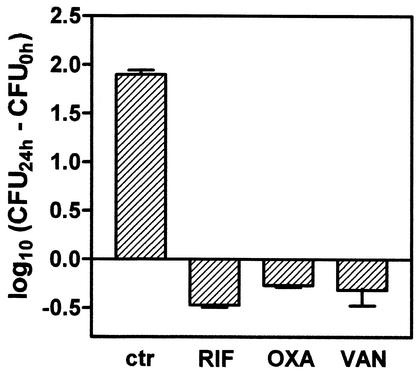
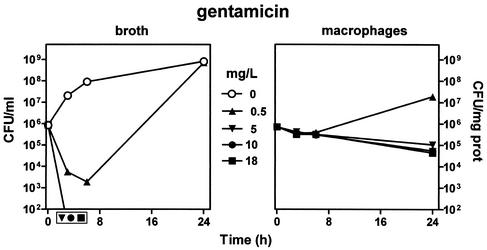
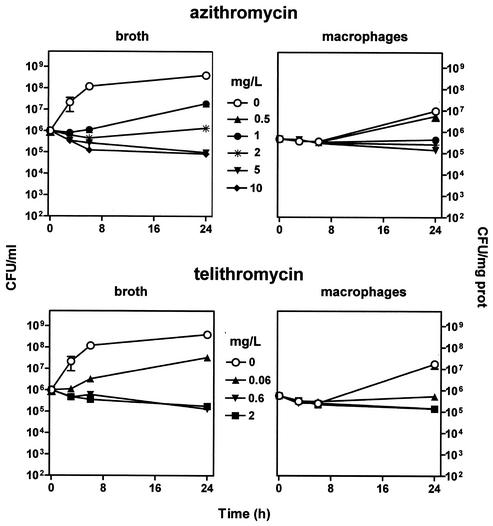
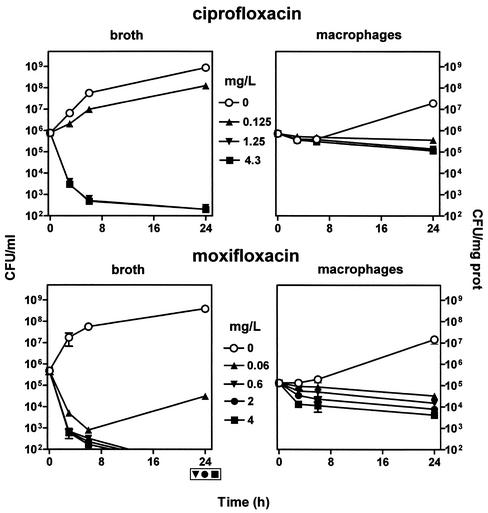
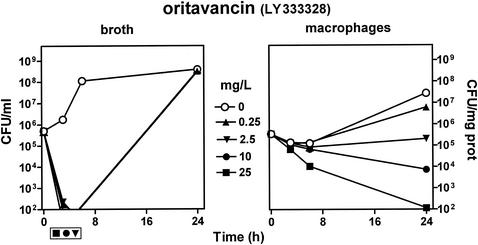
Using J774 macrophages, the intracellular activities of gentamicin, azithromycin, telithromycin, ciprofloxacin, moxifloxacin, and oritavancin (LY333328) against Staphylococcus aureus (strain ATCC 25923) have been quantitatively assessed in a 24-h model. S. aureus was positively localized in phagolysosomes by confocal and electron microscopy, and extracellular growth was prevented with 0.5 mg of gentamicin/liter (1x MIC) in controls. When tested at extracellular concentrations equivalent to their maximum concentrations in human serum, all antibiotics except azithromycin caused a significant reduction of the postphagocytosis inoculum within 24 h, albeit to markedly different extents (telithromycin [2 mg/liter], 0.60 log; ciprofloxacin [4.3 mg/liter], 0.81 log; gentamicin [18 mg/liter], 1.21 log; moxifloxacin [4 mg/liter], 1.51 log; oritavancin [25 mg/liter], 3.49 log). Intracellular activities were not systematically related to drug accumulation (apparent cellular-to-extracellular concentration ratios in infected cells: ciprofloxacin, 3.2; gentamicin, 6.8; telithromycin, 8.7; moxifloxacin, 13.4; azithromycin, 50; oritavancin, 348). Intracellular activity was not directly correlated to extracellular activity as measured in broth. Conditions of pH 5 (i.e., mimicking that of phagolysosomes) markedly reduced the activity of gentamicin, azithromycin, and telithromycin (>or=32 x) and fairly extensively reduced that of ciprofloxacin and moxifloxacin (>or=4 x) but did not affect oritavancin activity. We conclude that the cellular accumulation of antibiotics is not the only parameter to take into account for intracellular activity but that local environmental conditions (such as pH) and other factors can also prove critical.
Figures
Similar articles
-
Pharmacodynamic evaluation of the intracellular activities of antibiotics against Staphylococcus aureus in a model of THP-1 macrophages.Antimicrob Agents Chemother. 2006 Mar;50(3):841-51. doi: 10.1128/AAC.50.3.841-851.2006. Antimicrob Agents Chemother. 2006. PMID: 16495241 Free PMC article.
-
Comparative intracellular (THP-1 macrophage) and extracellular activities of beta-lactams, azithromycin, gentamicin, and fluoroquinolones against Listeria monocytogenes at clinically relevant concentrations.Antimicrob Agents Chemother. 2002 Jul;46(7):2095-103. doi: 10.1128/AAC.46.7.2095-2103.2002. Antimicrob Agents Chemother. 2002. PMID: 12069960 Free PMC article.
-
Comparative activity of quinolones (ciprofloxacin, levofloxacin, moxifloxacin and garenoxacin) against extracellular and intracellular infection by Listeria monocytogenes and Staphylococcus aureus in J774 macrophages.J Antimicrob Chemother. 2005 Apr;55(4):511-7. doi: 10.1093/jac/dki059. Epub 2005 Feb 24. J Antimicrob Chemother. 2005. PMID: 15731197
-
Effects of amoxicillin, gentamicin, and moxifloxacin on the hemolytic activity of Staphylococcus aureus in vitro and in vivo.Antimicrob Agents Chemother. 2001 Jan;45(1):196-202. doi: 10.1128/AAC.45.1.196-202.2001. Antimicrob Agents Chemother. 2001. PMID: 11120965 Free PMC article.
-
Can intracellular Staphylococcus aureus in osteomyelitis be treated using current antibiotics? A systematic review and narrative synthesis.Bone Res. 2022 Aug 12;10(1):53. doi: 10.1038/s41413-022-00227-8. Bone Res. 2022. PMID: 35961964 Free PMC article. Review.
Cited by
-
Differential immune responses to Segniliparus rotundus and Segniliparus rugosus infection and analysis of their comparative virulence profiles.PLoS One. 2013;8(3):e59646. doi: 10.1371/journal.pone.0059646. Epub 2013 Mar 29. PLoS One. 2013. PMID: 23555735 Free PMC article.
-
Pharmacodynamic evaluation of the intracellular activities of antibiotics against Staphylococcus aureus in a model of THP-1 macrophages.Antimicrob Agents Chemother. 2006 Mar;50(3):841-51. doi: 10.1128/AAC.50.3.841-851.2006. Antimicrob Agents Chemother. 2006. PMID: 16495241 Free PMC article.
-
Mixed-lipid storage disorder induced in macrophages and fibroblasts by oritavancin (LY333328), a new glycopeptide antibiotic with exceptional cellular accumulation.Antimicrob Agents Chemother. 2005 May;49(5):1695-700. doi: 10.1128/AAC.49.5.1695-1700.2005. Antimicrob Agents Chemother. 2005. PMID: 15855483 Free PMC article.
-
Modulation of the cellular accumulation and intracellular activity of daptomycin towards phagocytized Staphylococcus aureus by the P-glycoprotein (MDR1) efflux transporter in human THP-1 macrophages and madin-darby canine kidney cells.Antimicrob Agents Chemother. 2007 Aug;51(8):2748-57. doi: 10.1128/AAC.00090-07. Epub 2007 Jun 4. Antimicrob Agents Chemother. 2007. PMID: 17548493 Free PMC article.
-
Influence of efflux transporters on the accumulation and efflux of four quinolones (ciprofloxacin, levofloxacin, garenoxacin, and moxifloxacin) in J774 macrophages.Antimicrob Agents Chemother. 2005 Jun;49(6):2429-37. doi: 10.1128/AAC.49.6.2429-2437.2005. Antimicrob Agents Chemother. 2005. PMID: 15917543 Free PMC article.
References
-
- Alexander, E. H., and M. C. Hudson. 2001. Factors influencing the internalization of Staphylococcus aureus and impacts on the course of infections in humans. Appl. Microbiol. Biotechnol. 56:361-366. - PubMed
-
- al Nawas, B., and P. M. Shah. 1998. Intracellular activity of vancomycin and Ly333328, a new semisynthetic glycopeptide, against methicillin-resistant Staphylococcus aureus. Infection 26:165-167. - PubMed
-
- al Nawas, B., and P. M. Shah. 1998. Intracellular activity of ciprofloxacin and moxifloxacin, a new 8-methoxyquinolone, against methicillin-resistant Staphylococcus aureus. J. Antimicrob. Chemother. 41:655-658. - PubMed
-
- Anderson, R., and G. K. Joone. 1993. In vitro investigation of the intraphagocytic bioactivities of ciprofloxacin and the new fluoroquinolone agents, clinafloxacin (CI- 960) and PD 131628. Chemotherapy 39:424-431. - PubMed
-
- Andes, D., and W. A. Craig. 2002. Animal model pharmacokinetics and pharmacodynamics: a critical review. Int. J. Antimicrob. Agents 19:261-268. - PubMed
Publication types
MeSH terms
Substances
LinkOut - more resources
Full Text Sources
Medical
Molecular Biology Databases
