. 2003 Jun 23;161(6):1029-34.
doi: 10.1083/jcb.200301147.

Dynamic instability of microtubules is regulated by force

Affiliations

Dynamic instability of microtubules is regulated by force

Marcel E Janson et al. J Cell Biol. .

Abstract

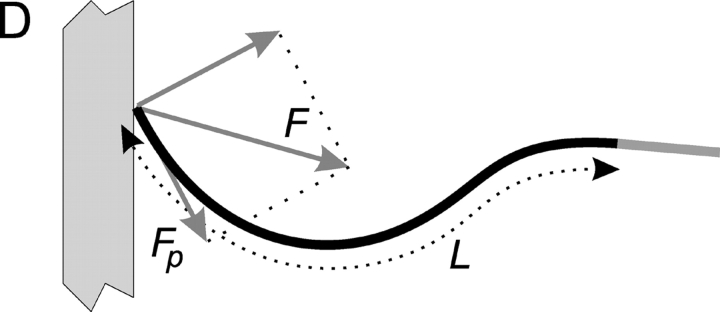
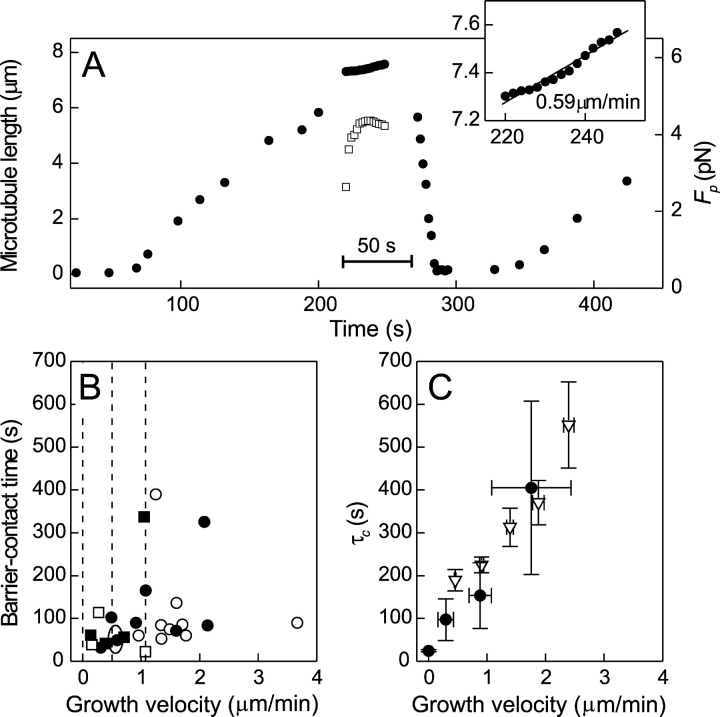
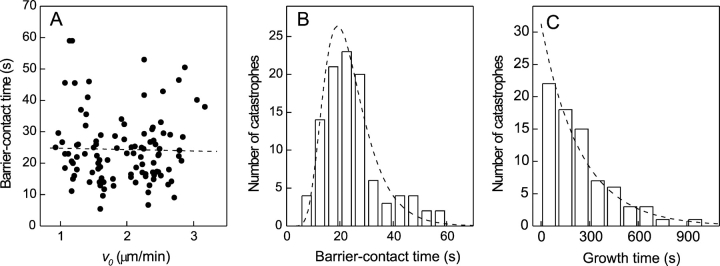
Microtubules are long filamentous protein structures that randomly alternate between periods of elongation and shortening in a process termed dynamic instability. The average time a microtubule spends in an elongation phase, known as the catastrophe time, is regulated by the biochemical machinery of the cell throughout the cell cycle. In this light, observed changes in the catastrophe time near cellular boundaries (Brunner, D., and P. Nurse. 2000. Cell. 102:695-704; Komarova, Y.A., I.A. Vorobjev, and G.G. Borisy. 2002. J. Cell Sci. 115:3527-3539) may be attributed to regulatory effects of localized proteins. Here, we argue that the pushing force generated by a microtubule when growing against a cellular object may itself provide a regulatory mechanism of the catastrophe time. We observed an up to 20-fold, force-dependent decrease in the catastrophe time when microtubules grown from purified tubulin were polymerizing against microfabricated barriers. Comparison with catastrophe times for microtubules growing freely at different tubulin concentrations leads us to conclude that force reduces the catastrophe time only by limiting the rate of tubulin addition.


Figures

Figure 1.
Figure 1.
DIC microscopy images of MTs undergoing catastrophes under the influence of force. (A) Schematic side view of the experiment. Seeds attached to the surface (dark regions) nucleate free dynamic MTs in between barriers. A 0.5-μm-deep etched overhang prevents MTs from creeping up the 2-μm-high barrier. Barrier spacing is 60 μm, and barrier width is 15 μm. Picture is not to scale. (B) Microscopy images of a growing and subsequently buckling MT (C T = 28 μM), showing the initiation of growth (t = 0 s), establishment of barrier-contact (194 s), buckling (237 s), relaxation of the buckled MT after a catastrophe (240 s), and the continuation of shortening (252 s). Bar, 5 μm. (C) Microscopy images of a stalled MT (C T = 28 μM), showing growth initiation (t = 0 s), the moment just before a catastrophe while contacting the barrier (117 s), shortening (122 s and 128 s), and regrowth (169 s). The lateral motion of the segment in the box is analyzed in Fig. S1. (D) Parameters derived from the shape analysis. The buckling MT (black) generates a force, F, in contact with the barrier. The parallel component, F p, is responsible for the reduction in MT growth velocity. The length, L, of the MT is given by the distance between the point of barrier contact and the clamped seed (gray area of the MT). See also Video 2 and Fig. S1 available at http://www.jcb.org/cgi/content/full/jcb.200301147/DC1.
Figure 1.
Figure 1.
DIC microscopy images of MTs undergoing catastrophes under the influence of force. (A) Schematic side view of the experiment. Seeds attached to the surface (dark regions) nucleate free dynamic MTs in between barriers. A 0.5-μm-deep etched overhang prevents MTs from creeping up the 2-μm-high barrier. Barrier spacing is 60 μm, and barrier width is 15 μm. Picture is not to scale. (B) Microscopy images of a growing and subsequently buckling MT (C T = 28 μM), showing the initiation of growth (t = 0 s), establishment of barrier-contact (194 s), buckling (237 s), relaxation of the buckled MT after a catastrophe (240 s), and the continuation of shortening (252 s). Bar, 5 μm. (C) Microscopy images of a stalled MT (C T = 28 μM), showing growth initiation (t = 0 s), the moment just before a catastrophe while contacting the barrier (117 s), shortening (122 s and 128 s), and regrowth (169 s). The lateral motion of the segment in the box is analyzed in Fig. S1. (D) Parameters derived from the shape analysis. The buckling MT (black) generates a force, F, in contact with the barrier. The parallel component, F p, is responsible for the reduction in MT growth velocity. The length, L, of the MT is given by the distance between the point of barrier contact and the clamped seed (gray area of the MT). See also Video 2 and Fig. S1 available at http://www.jcb.org/cgi/content/full/jcb.200301147/DC1.
Figure 2.
Figure 2.
Analysis of MT dynamics. (A) The length (•) of a growing MT before, during, and after buckling together with the force F p (□) as a function of time (C T = 28 μM). Nucleation from a seed (t = 60 s) is followed by growth at an average rate of 2.5 ± 0.1 μm/min. After initiation of barrier-contact (t = 220 s), the average growth velocity equals 0.59 ± 0.03 μm/min (inset). Detailed length information was lost after the MT slipped over a small distance (t = 250 s). A catastrophe (t = 270 s) causes rapid shortening. The barrier-contact time, equal to 270–220 = 50 s is indicated with a horizontal bar. (B) Barrier-contact times for all buckling MTs plotted as a function of the growth velocity during buckling. C T = 20 μM (□ and ▪) or 28 μM (○ and •). Times are shown for MTs that undergo a catastrophe (▪ and •) and for MTs that relax by sliding (□ and ○). The event depicted in A is encircled. (C) Catastrophe time, τc, inferred from various experiments as a function of average growth velocity. The data for free growth were obtained at C T = 7.2, 10, 15.2, 20, and 28 μM (∇). For buckling MTs (•), τc was determined in three growth velocity regimes (0–0.5, 0.50–1.08, and >1.08 μm/min; vertical lines in B) using the data in B. The SD of the averaged velocities and the standard errors on τc are indicated. The average τc for stalled MTs (see Fig. 3) is plotted at zero growth velocity.
Figure 3.
Figure 3.
Comparison of the catastrophe time distribution for stalled and free MTs. (A) Barrier-contact times of 103 stalled, nonbuckling MTs measured at C T = 15.2, 20, and 28 μM as a function of v0, the growth velocity before barrier-contact. A fitted straight line demonstrates the lack of correlation between the two quantities (correlation coefficient R = −0.02, P = 0.82). (B) A histogram of the 103 barrier-contact times together with the prediction of a simple model (dotted line; see Results and Discussion). (C) Distribution of free catastrophe times for 76 events at C T = 10 μM with an average τcvalue of 243 s. The dotted line indicates an exponential distribution with the same average τc. See also Fig. S2 available at http://www.jcb.org/cgi/content/full/jcb.200301147/DC1.

References

    1. Brunner, D., and P. Nurse. 2000. CLIP170-like tip1p spatially organizes microtubular dynamics in fission yeast. Cell. 102:695–704. - PubMed
    1. Desai, A., and T.J. Mitchison. 1997. Microtubule polymerization dynamics. Annu. Rev. Cell Dev. Biol. 13:83–117. - PubMed
    1. Dogterom, M., and B. Yurke. 1997. Measurement of the force-velocity relation for growing microtubules. Science. 278:856–860. - PubMed
    1. Dogterom, M., M.E. Janson, C. Faivre-Moskalenko, A. Van der Horst, J.W.J. Kerssemakers, C. Tanase, and B.M. Mulder. 2002. Force generation by polymerizing microtubules. Appl. Physics A-Mater. Sci. Process. 75:331–336.
    1. Doorn, G.S.v., C. Tanase, B.M. Mulder, and M. Dogterom. 2000. On the stall force for growing microtubules. Eur. Biophys. J. Biophys. Lett. 29:2–6. - PubMed

Publication types