. 2003 Sep 5;278(36):33730-7.
doi: 10.1074/jbc.M305023200. Epub 2003 Jun 22.

Ca2+-calmodulin-dependent protein kinase II potentiates store-operated Ca2+ current

Affiliations

Ca2+-calmodulin-dependent protein kinase II potentiates store-operated Ca2+ current

Khaled Machaca. J Biol Chem. .

Abstract

A rise in intracellular Ca2+ (Ca2+i) mediates various cellular functions ranging from fertilization to gene expression. A ubiquitous Ca2+ influx pathway that contributes significantly to the generation of Ca2+i signals, especially in non-excitable cells, is store-operated Ca2+ entry (SOCE). Consequently, the modulation of SOCE current affects Ca2+i dynamics and thus the ensuing cellular response. Therefore, it is important to define the mechanisms that regulate SOCE. Here we show that a rise in Ca2+i potentiates SOCE. This potentiation is mediated by Ca2+-calmodulin-dependent protein kinase II (CaMKII), because inhibition of endogenous CaMKII activity abrogates Ca2+i-mediated SOCE potentiation and expression of constitutively active CaMKII potentiates SOCE current independently of Ca2+i. Moreover, we present evidence that CaMKII potentiates SOCE by altering SOCE channel gating. The regulation of SOCE by CaMKII defines a novel modulatory mechanism of SOCE with important physiological consequences.


Figures
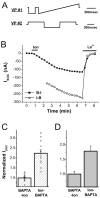
Fig. 1
Fig. 1. Intracellular Ca2+ rise potentiates ISOC.
A, voltage protocols (VP) used to measure ISOC (#1) and to induce Ca2+ influx (#2). For VP#1, the cell was stepped to −140 mV followed by a ramp from −140 to 50 mV from a holding potential of −20 mV repeated once every 20 s. For VP#2, the cell was stepped to +40, −140, and +40 mV sequentially from a holding potential of −40 mV once every 30 s. B, time course of ISOC activation following the BAPTA-Ion (B-I) or Ion-BAPTA (I-B) protocols. For the BAPTA-Ion protocol, oocytes were injected with BAPTA (7 nmol/oocyte) followed by ionomycin (10 μm) treatment as indicated by the line. ISOC was measured as the average current 30–35 ms after stepping to − 140 mV in VP#1. For the Ion-BAPTA protocol, cells were treated with ionomycin and repetitively subjected to VP#2 for 10 min before ISOC recording (open circles). La3+ (100 μM) was added at the end of the experiment to block ISOC. C, summary of ISOC levels following the BAPTA-Ion (n = 14) and Ion-BAPTA (n = 12) protocols. The data are plotted as mean ± S.E. (p = 1.6 × 10⁻⁷). D, Ca2+i rise potentiates ISOC independently of hyperpolarization-induced Ca2+ influx. Cells (in 5 mM Ca2+) were exposed to ionomycin for 5 min and then injected with BAPTA (Ion-BAPTA), and ISOC was measured as described in B, BAPTA-Ion treatment was as described in B. The means are significantly different (p = 0.0044; n = 5).
Fig. 2
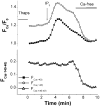
Fig. 2. Partial store depletion fully activates SOCE.
Oocyte was loaded with Ca2+-Green-1-dextran (7 μM) and incubated in thapsigargin (Thaps) (1 μM) for 1 h to partially deplete intracellular Ca2+ stores. SOCE was measured by clamping the cell using voltage protocol number 2 (Fig. 1A) as described by Machaca and Hartzell (19). Ca2+-Green- 1-dextran fluorescence at +40 mV (FCa(+40); close squares) provides basal Ca2+ levels because there is minimal Ca2+ influx at this voltage (19). In contrast, Ca2+ influx through SOCE channels is induced at −140 mV, resulting in increased Ca2+-Green-1-dextran fluorescence (FCa(−140); open circles). Therefore, the difference between CG1 fluorescence at −140 and +40 mV provides a measure of SOCE. Partial store depletion with a short thapsigargin incubation (1 h) activates SOCE. Injection of IP3 (~2 μM) leads to further Ca2+ release from stores as indicated by increased Ca2+-Green-1-dextran fluorescence at both voltages (squares and circles). However, the additional Ca2+ release leading to further store depletion does not enhance SOCE (open triangles). Switching the cell to Ca2+-free solution results in a loss of the Ca2+- Green-1-dextran fluorescence signal at −140 mV, confirming that the signal is because of Ca2+ influx. These data are representative of four similar experiments.
Fig. 3
Fig. 3. Receptor mediated Ca2+ release levels correlate with SOCE.
Oocytes were injected with serotonin receptor 1c (5HT1c) RNA at either 10 or 30 ng/oocyte and were allowed to express for 2 days. The activity of the endogenous Ca2+-activated Cl currents (ICl1 and ICl1T) were recorded. ICl1 and ICl1T provide endogenous reporters of Ca2+ release (ICl1) and SOCE (ICl1T) (see “Results” for details). A, voltage protocol and representative current traces of the Ca2+-activated Cl currents. ICl1 is a sustained current recorded at +40 mV, whereas ICl1T is a transient current detected at +40 mV after the −140 mV hyperpolarization step. B and C, time course of ICl1 and ICl1T is cells injected with 10 ng (B) or 30 ng (C) 5HT1c RNA. The time course of ICl1 was plotted as the current at the end of the first +40-mV pulse (square in A), and that of ICl1T was plotted as the maximal current during the second +40-mV pulse (circle in A). C, higher 5HT1c expression results in increased levels of both ICl1 and ICl1T. D, mean ICl1 and ICl1T current levels (±S.E.) in cells expressing low (10 ng, hatched bars) and high levels (30 ng, filled bars) of 5HT1c. Increasing the expression of 5HT1c results in higher levels of ICl1 (indicative of Ca2+ release) and ICl1T (indicative of SOCE).
Fig. 4
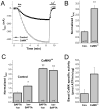
Fig. 4. CaMKIIca potentiates ISOC.
Oocytes were injected with a constitutively active CaMKII (CaMKIIca, 1 ng/oocyte) and allowed to express for 12–16 h. SOCE was measured using voltage protocol number 1 in Fig. 1A with the exception that the voltage was stepped to −120 mV instead of −140 mV. A, time course of ISOC activation in control and CaMKIIca expressing cells. B, normalized ISOC levels (n as indicated; p = 1.1 × 10⁻⁷). C, normalized ISOC levels from control (Con.) and CaMKIIca-injected cells treated according to the BAPTA-Ion or Ion-BAPTA protocols as described in Fig. 1. The asterisks above the bars indicate the significantly different groups (n as indicated; p < 0.0164). D, basal CaMKII kinase activity from control and CaMKIIca-injected oocytes measured using an in vitro kinase assay without the addition of Ca2+-CaM (n = 5; p = 0.0469).
Fig. 5
Fig. 5. Inhibition of endogenous CaMKII blocks Ca2+ i-mediated SOCE potentiation.
Control and AIP-injected (Inj.) (10 μM) oocytes were treated according to the BAPTA-Ion and Ion-BAPTA protocols as indicated. A, normalized ISOC levels in the different treatment groups. The asterisk indicates the only significantly different group (p < 2.1 × 10⁻⁴). B, basal CaMKII activity in oocyte lysate without AIP (Con) and with 10 and 40 μM AIP as indicated (n = 6).
Fig. 6
Fig. 6. CaMKII potentiates ISOC by increasing the levels of CDP.
Cells were incubated with thapsigargin (Thaps) (1 μM) in nominally Ca2+-free medium (50 μM) for 3 h to fully deplete Ca2+ stores. A subset of cells was then injected with 1 ng of CaMKIIca RNA (Thaps-CaMKca) and incubated in nominally Ca2+-free medium for 12–16 h. A, ISOC recorded from a representative control (Thaps) and CaMKIIca-injected oocyte (Thaps-CaMKca). Cells were incubated in Ca2+-free solution (70 Mg2+) before switching to Ca2+-containing solution (30 Ca2+) as indicated by the line. SOCE was measured using voltage protocol number 1 in Fig. 1A with the exception that the voltage was stepped to −120 mV instead of −140 mV. The addition of La3+ to block ISOC is also indicated. B, normalized ISOC levels showing initial ISOC (indicated by the asterisk in A) and maximal ISOC at the end of the experiment (indicated by the open square and filled circle in the Thaps and Thaps-CaMKca groups, respectively). The average levels of CDP calculated as maximal ISOC/initial ISOC are also shown. Maximal ISOC and CDP are significantly different between the two groups (p < 0.00132). C and D, current traces in response to a step voltage (−20 to −120 mV for 500 ms) (C) and a current ramp (−140 to +50 mV) (D) obtained at different time points during the experiment as indicated in A. E and F, superimposed current traces of maximal ISOC from Thaps and Thaps-CaMKIIca-treated cells in response to a step voltage pulse (E) and a voltage ramp (F).

Similar articles

Cited by

References

    1. Parekh AB, Penner R. Physiol Rev. 1997;77:901–930. - PubMed
    1. Parekh AB, Foguet M, Lubbert H, Stühmer W. J Physiol (Lond) 1993;469:653–671. - PMC - PubMed
    1. Fomina AF, Nowycky MC. J Neurosci. 1999;19:3711–3722. - PMC - PubMed
    1. O’Toole CM, Arnoult C, Darszon A, Steinhardt RA, Florman HM. Mol Biol Cell. 2000;11:1571–1584. - PMC - PubMed
    1. Serafini A, Lewis RS, Clipstone NA, Bram R, Fanger C, Fiering S, Herzenberg LA, Crabtree GR. Immunity. 1995;3:239–250. - PubMed

Publication types

Substances

LinkOut - more resources