

Differential effect of muscle vibration on intracortical inhibitory circuits in humans
- PMID: 12821723
- PMCID: PMC2343209
- DOI: 10.1113/jphysiol.2003.043752
Differential effect of muscle vibration on intracortical inhibitory circuits in humans
Erratum in
- J Physiol. 2003 Nov 1;552(Pt 3):993-5
Abstract
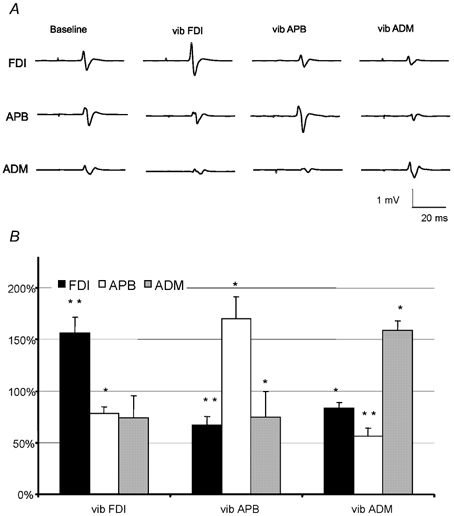
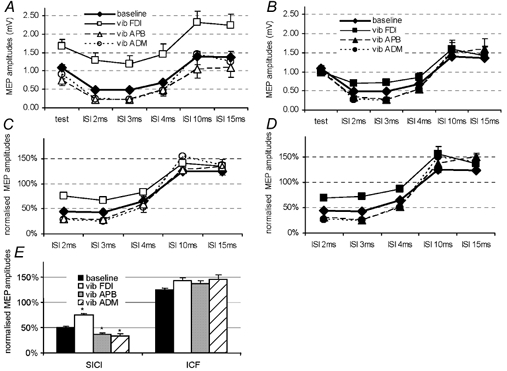
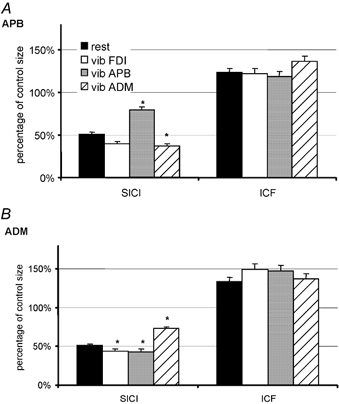
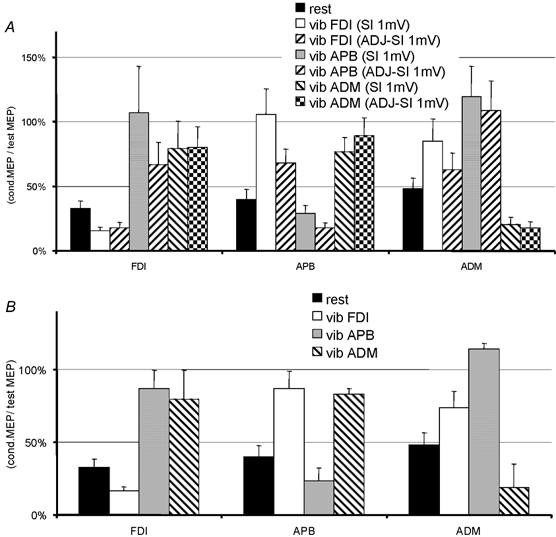
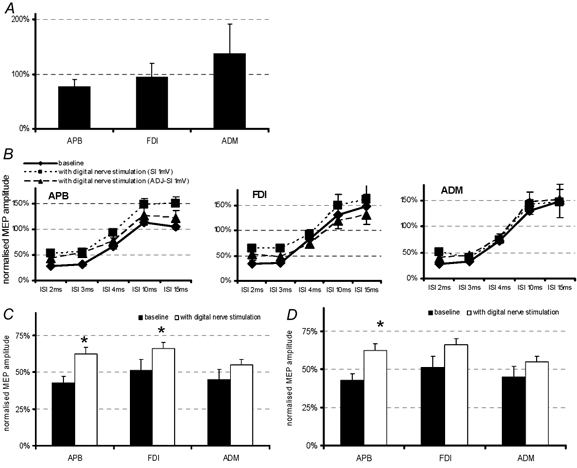
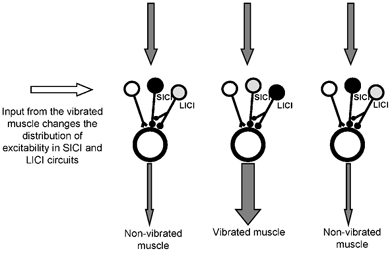
Low amplitude muscle vibration (0.5 ms; 80 Hz; duration 1.5 s) was applied in turn to each of three different intrinsic hand muscles (first dorsal interosseus, FDI; abductor pollicis brevis, APB; and abductor digiti minimi, ADM) in order to test its effect on the EMG responses evoked by transcranial magnetic stimulation (TMS). Recordings were also taken from flexor and extensor carpi radialis (FCR and ECR, respectively). We evaluated the amplitude of motor evoked potentials (MEPs) produced by a single TMS pulse, short interval intracortical inhibition and facilitation (SICI and ICF) and long interval intracortical inhibition (LICI). TMS pulses were applied 1 s after the start of vibration with subjects relaxed throughout. Vibration increased the amplitude of MEPs evoked in the vibrated muscle (162 +/- 6 % of MEP with no vibration; mean +/- S.E.M.), but suppressed MEPs in the two non-vibrated hand muscles (72 +/- 9 %). Compared with no vibration (test response reduced to 51 +/- 5 % of control), there was less SICI in the vibrated muscle (test response reduced to 92 +/- 28 % of control) and more in the non-vibrated hand muscles (test response reduced to 27 +/- 5 % of control). The opposite occurred for LICI: compared with the no vibration condition (test response reduced to 33 +/- 6 % control), there was more LICI in the vibrated muscle (test response reduced to 17 +/- 3 % control) than in the non-vibrated hand muscles (test response reduced to 80 +/- 11 % control) even when the intensity of the test stimulus was adjusted to compensate for the changes in baseline MEP. There was no effect on ICF. Cutaneous stimulation of the index finger (80 Hz, 1.5 s duration, twice sensory threshold) had no consistent differential effect on any of the parameters. We conclude that vibratory input from muscle can differentially modulate excitability in motor cortical circuits.
Figures
Similar articles
-
Modulation of intracortical excitability in human hand motor areas. The effect of cutaneous stimulation and its topographical arrangement.Exp Brain Res. 2005 Jun;163(3):335-43. doi: 10.1007/s00221-004-2176-7. Epub 2005 Jan 15. Exp Brain Res. 2005. PMID: 15654586
-
Transcallosal sensorimotor integration: effects of sensory input on cortical projections to the contralateral hand.Clin Neurophysiol. 2006 Apr;117(4):855-63. doi: 10.1016/j.clinph.2005.12.012. Epub 2006 Jan 30. Clin Neurophysiol. 2006. PMID: 16448846
-
Afferent-induced facilitation of primary motor cortex excitability in the region controlling hand muscles in humans.Eur J Neurosci. 2009 Aug;30(3):439-48. doi: 10.1111/j.1460-9568.2009.06815.x. Epub 2009 Jul 7. Eur J Neurosci. 2009. PMID: 19686433
-
The effect of muscle vibration on short latency intracortical inhibition in humans.Eur J Appl Physiol. 2014 Oct;114(10):2073-80. doi: 10.1007/s00421-014-2930-x. Epub 2014 Jun 17. Eur J Appl Physiol. 2014. PMID: 24934229
-
Focal reduction of intracortical inhibition in the motor cortex by selective proprioceptive stimulation.Exp Brain Res. 2003 Mar;149(1):9-16. doi: 10.1007/s00221-002-1330-3. Epub 2003 Jan 15. Exp Brain Res. 2003. PMID: 12592499
Cited by
-
Modulation of sensorimotor cortex by repetitive peripheral magnetic stimulation.Front Hum Neurosci. 2015 Jul 14;9:407. doi: 10.3389/fnhum.2015.00407. eCollection 2015. Front Hum Neurosci. 2015. PMID: 26236220 Free PMC article.
-
Use of imperceptible wrist vibration to modulate sensorimotor cortical activity.Exp Brain Res. 2019 Mar;237(3):805-816. doi: 10.1007/s00221-018-05465-z. Epub 2019 Jan 3. Exp Brain Res. 2019. PMID: 30607471 Free PMC article.
-
The effect of sensory input and attention on the sensorimotor organization of the hand area of the human motor cortex.J Physiol. 2004 Nov 15;561(Pt 1):307-20. doi: 10.1113/jphysiol.2004.069328. Epub 2004 Sep 23. J Physiol. 2004. PMID: 15388776 Free PMC article.
-
Differential modulation of motor cortical plasticity and excitability in early and late phases of human motor learning.J Neurosci. 2007 Oct 31;27(44):12058-66. doi: 10.1523/JNEUROSCI.2663-07.2007. J Neurosci. 2007. PMID: 17978047 Free PMC article.
-
Test-retest reliability of short-interval intracortical inhibition and intracortical facilitation in patients with schizophrenia.Psychiatry Res. 2018 Sep;267:575-581. doi: 10.1016/j.psychres.2018.06.014. Epub 2018 Jun 19. Psychiatry Res. 2018. PMID: 30032068 Free PMC article.
References
-
- Chen R, Corwell B, Hallett M. Modulation of motor cortex excitability by median nerve and digit stimulation. Exp Brain Res. 1999a;129:77–86. - PubMed
-
- Chen R, Lozano AM, Ashby P. Mechanisms of the silent period following transcranial magnetic stimulation. Evidence from epidural recordings. Exp Brain Res. 1999b;128:539–542. - PubMed
-
- Classen J, Steinfelder B, Liepert J, Stefan K, Celnik P, Cohen LG, Hess A, Kunesch E, Chen R, Benecke R, Hallett M. Cutaneomotor integration in humans is somatotopically organized at various levels of the nervous system and is task dependent. Exp Brain Res. 2000;130:48–59. - PubMed
-
- Claus D, Mills KR, Murray NMF. The influence of vibration on the excitability of alpha motoneurones. Electroencephalogr Clin Neurophysiol. 1988a;69:431–436. - PubMed
Publication types
MeSH terms
Substances
LinkOut - more resources
Full Text Sources
Medical