. 2003 Jul 1;31(13):3518-24.
doi: 10.1093/nar/gkg579.

MultiPipMaker and supporting tools: Alignments and analysis of multiple genomic DNA sequences

Affiliations

MultiPipMaker and supporting tools: Alignments and analysis of multiple genomic DNA sequences

Scott Schwartz et al. Nucleic Acids Res. .

Abstract

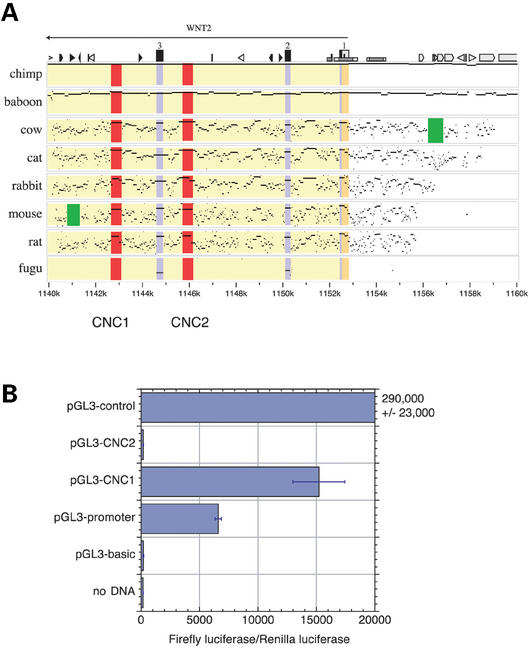
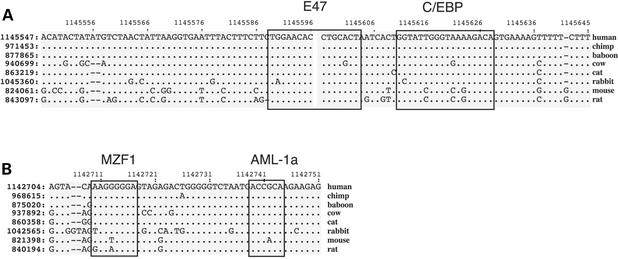
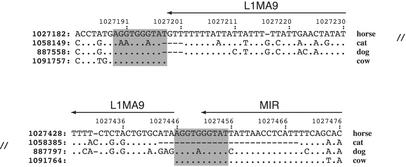
Analysis of multiple sequence alignments can generate important, testable hypotheses about the phylogenetic history and cellular function of genomic sequences. We describe the MultiPipMaker server, which aligns multiple, long genomic DNA sequences quickly and with good sensitivity (available at http://bio.cse.psu.edu/ since May 2001). Alignments are computed between a contiguous reference sequence and one or more secondary sequences, which can be finished or draft sequence. The outputs include a stacked set of percent identity plots, called a MultiPip, comparing the reference sequence with subsequent sequences, and a nucleotide-level multiple alignment. New tools are provided to search MultiPipMaker output for conserved matches to a user-specified pattern and for conserved matches to position weight matrices that describe transcription factor binding sites (singly and in clusters). We illustrate the use of MultiPipMaker to identify candidate regulatory regions in WNT2 and then demonstrate by transfection assays that they are functional. Analysis of the alignments also confirms the phylogenetic inference that horses are more closely related to cats than to cows.


Figures

Figure 1
Figure 1
Constructing a multiple alignment. (A) Constructing a row of the crude multiple alignment. One of the secondary sequences (e.g. sequence r) consists of two contigs. The pairwise alignments between the reference sequence and the two contigs are shown in a dot-plot format, in which the positions of each local alignment are plotted as a series of diagonal lines. For clarity, the four major local alignments are numbered and enclosed in shaded parallelograms. To construct a row in the crude multiple alignment, the local alignments are pruned so that each position in the reference sequence is aligned at most once. In this illustration, interval a-b is aligned to the reverse complement of B–A, b–c is aligned to B–C, c–d is aligned to C′–D, and e–g is aligned to E–G. This necessitates some pruning since some positions in the reference sequence are aligned more than once, e.g. the positions just before b. Extraneous matches to an improperly masked repetitive element around position f are discarded. Row r of the crude multiple alignment is constructed from the aligned intervals listed above. Gaps within a local pairwise alignment, say between a and b, result in ‘internal gaps’ in row r of the multiple alignment, which are penalized. A region between aligned segments (e.g. region z–a or d–e) is considered an ‘end-gap’ and is not penalized. Note that segment E–D of the secondary sequence appears twice in row r. (B) Refinement of the multiple alignment. One cycle of the refinement process is shown schematically. The crude multiple alignment is shown as a series of rows with thick lines representing strings of nucleotides; gaps are spaces in the rows. A subalignment between positions i and j is extracted and row r removed. The subalignment and row r are reduced by removing gaps as described in the Methods, and a new alignment is computed between the sequence in row r and the reduced subalignment (without row r). If this process improves the alignment score, then the new subalignment is spliced back into the large alignment. This process is repeated for all sub-regions where the alignment's columns have changed.
Figure 2
Figure 2
Multiple percent identity plots (MultiPip) of the WNT2 region and tests of predicted regulatory elements. (A) MultiPip of the WNT2 region. Sequence data are from the June 2002 freeze of the NISC Comparative Sequencing Program (13). Local alignments between the human sequence and each second sequence (indicated on the left) are computed and displayed as the position in the human sequence (horizontal axis) and percent identity (from 50 to 100% along the vertical axis) of each gap-free aligning segment. Features in the human sequence are annotated above the graphs. Genes are labeled above arrows showing the direction of transcription, and exons are shown as numbered rectangles (black if protein-coding, gray if untranslated). Low rectangles denote CpG islands, shown as white if 0.6≤CpG/GpC<0.75 and as gray if CpG/GpC≥0.75. Interspersed repeats are shown by the following icons: white pointed boxes are L1 repeats, light gray triangles are SINEs other than MIR, black triangles are MIRs, black pointed boxes are LINE2s, and dark gray triangles and pointed boxes are other kinds of interspersed repeats, such as LTR elements and DNA transposons. Areas within these percent identity plots are colored light green for introns, blue for coding exons, yellow for noncoding exons, and red for notably conserved noncoding, nonrepetitive regions. Green boxes highlight lineage-specific deletions in cow and mouse. (B) Tests of CNCs for effects on expression after transient transfection. The indicated plasmids encoding firefly luciferase were transfected into HeLa cells in triplicate with a co-transfection control expressing Renilla luciferase. Test plasmids contained CNC1 or CNC2 inserted upstream of the SV40 promoter driving the luciferase gene. Enzyme activity in cell extracts was measured 48 h after transfection. The graph shows the means and standard errors of the activity ratios (firefly luciferase activity from the test plasmid divided by Renilla luciferase activity from the co-transfection control). Detailed methods are provided at the website http://bio.cse.psu.edu.
Figure 3
Figure 3
Multiple alignments in the WNT2 CNCs annotated with matches to transcription factor binding sites. (A) Multiple alignment of part of CNC2 with a box drawn around the block identified by tffind as matching the E47-binding site. (B) Multiple alignment of part of CNC1 with boxes drawn around the blocks identified by tffind as matching the MZF1-binding site and the AML-1a-binding site.
Figure 4
Figure 4
An interspersed repeat that supports a phylogenetic reconstruction with horse closer to carnivores than to cow. The arrow points toward the A-rich 3′ tail of the transposon. The target-site duplication is shaded. Note that the AGGTGGGTAT at positions 1091764-1091773 in cow is aligned twice by MultiPipMaker.

References

    1. Kimura M. (1977) Preponderance of synonymous changes as evidence for the neutral theory of molecular evolution. Nature, 267, 275–276. - PubMed
    1. Li W.H., Gojobori,T. and Nei,M. (1981) Pseudogenes as a paradigm of neutral evolution. Nature, 292, 237–239. - PubMed
    1. Pennacchio L.A. and Rubin,E.M. (2001) Genomic strategies to identify mammalian regulatory sequences. Nature Rev. Genet., 2, 100–109. - PubMed
    1. Li W., Ellsworth,D., Krushkal,J., Chang,B. and Hewett-Emmett,D. (1996) Rates of nucleotide substitution in primates and rodents and the generation-time effect hypothesis. Mol. Phylogenet. Evol., 5, 182–187. - PubMed
    1. Wolfe K.H., Sharp,P.M. and Li,W.H. (1989) Mutation rates differ among regions of the mammalian genome. Nature, 337, 283–285. - PubMed

Publication types