

GeneFizz: A web tool to compare genetic (coding/non-coding) and physical (helix/coil) segmentations of DNA sequences. Gene discovery and evolutionary perspectives
- PMID: 12824434
- PMCID: PMC169033
- DOI: 10.1093/nar/gkg627
GeneFizz: A web tool to compare genetic (coding/non-coding) and physical (helix/coil) segmentations of DNA sequences. Gene discovery and evolutionary perspectives
Abstract
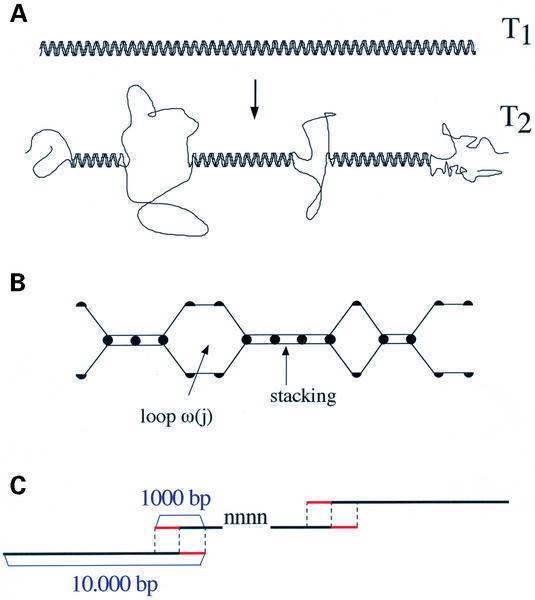
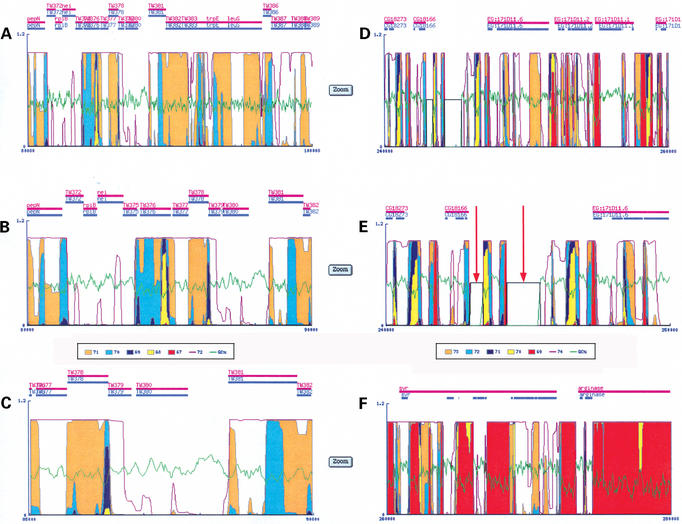
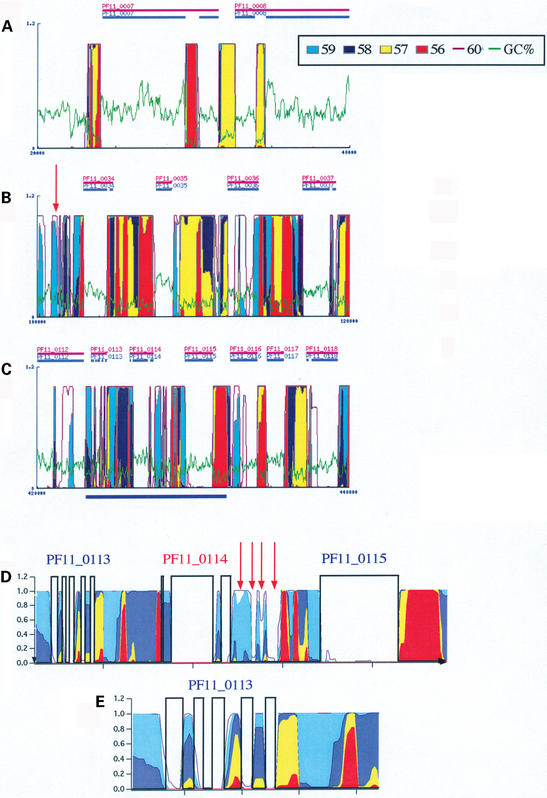
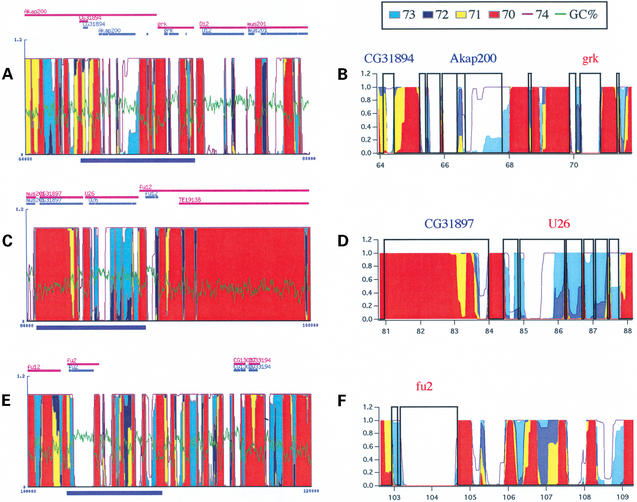
The GeneFizz (http://pbga.pasteur.fr/GeneFizz) web tool permits the direct comparison between two types of segmentations for DNA sequences (possibly annotated): the coding/non-coding segmentation associated with genomic annotations (simple genes or exons in split genes) and the physics-based structural segmentation between helix and coil domains (as provided by the classical helix-coil model). There appears to be a varying degree of coincidence for different genomes between the two types of segmentations, from almost perfect to non-relevant. Following these two extremes, GeneFizz can be used for two purposes: ab initio physics-based identification of new genes (as recently shown for Plasmodium falciparum) or the exploration of possible evolutionary signals revealed by the discrepancies observed between the two types of information.
Figures
Similar articles
-
The physics of DNA and the annotation of the Plasmodium falciparum genome.Gene. 2000 Sep 19;255(2):151-68. doi: 10.1016/s0378-1119(00)00300-0. Gene. 2000. PMID: 11024276
-
MICheck: a web tool for fast checking of syntactic annotations of bacterial genomes.Nucleic Acids Res. 2005 Jul 1;33(Web Server issue):W471-9. doi: 10.1093/nar/gki498. Nucleic Acids Res. 2005. PMID: 15980515 Free PMC article.
-
ETOPE: Evolutionary test of predicted exons.Nucleic Acids Res. 2003 Jul 1;31(13):3564-7. doi: 10.1093/nar/gkg597. Nucleic Acids Res. 2003. PMID: 12824366 Free PMC article.
-
Target Explorer: An automated tool for the identification of new target genes for a specified set of transcription factors.Nucleic Acids Res. 2003 Jul 1;31(13):3589-92. doi: 10.1093/nar/gkg544. Nucleic Acids Res. 2003. PMID: 12824372 Free PMC article.
-
Heuristic methods for finding pathogenic variants in gene coding sequences.J Am Heart Assoc. 2012 Oct;1(5):e002642. doi: 10.1161/JAHA.112.002642. Epub 2012 Oct 25. J Am Heart Assoc. 2012. PMID: 23316295 Free PMC article. Review. No abstract available.
Cited by
-
A unified Poland-Scheraga model of oligo- and polynucleotide DNA melting: salt effects and predictive power.Biophys J. 2009 Feb;96(3):1056-67. doi: 10.1529/biophysj.108.134031. Biophys J. 2009. PMID: 18849409 Free PMC article.
-
Applying small-scale DNA signatures as an aid in assembling soybean chromosome sequences.Adv Bioinformatics. 2010;2010:976792. doi: 10.1155/2010/976792. Epub 2010 Aug 19. Adv Bioinformatics. 2010. PMID: 20827309 Free PMC article.
-
A stitch in time: efficient computation of genomic DNA melting bubbles.Algorithms Mol Biol. 2008 Jul 17;3:10. doi: 10.1186/1748-7188-3-10. Algorithms Mol Biol. 2008. PMID: 18637171 Free PMC article.
-
The human genomic melting map.PLoS Comput Biol. 2007 May;3(5):e93. doi: 10.1371/journal.pcbi.0030093. Epub 2007 Apr 11. PLoS Comput Biol. 2007. PMID: 17511513 Free PMC article.
-
Subtelomere organization in the genome of the microsporidian Encephalitozoon cuniculi: patterns of repeated sequences and physicochemical signatures.BMC Genomics. 2016 Jan 7;17:34. doi: 10.1186/s12864-015-1920-7. BMC Genomics. 2016. PMID: 26744270 Free PMC article.
References
-
- Poland D. and Scheraga,H.R. (1970) Theory of Helix Coil Transitions in Biopolymers. Academic Press, New York.
-
- Cantor R.C. and Schimmel,P.R. (1980) Biophysical Chemistry. Part III: The Behaviour of Biological Macromolecules. W. H. Freeman and Company, New York.
-
- Yeramian E., Schaeffer,F., Caudron,B., Claverie,P. and Buc,H. (1990) An optimal formulation of the matrix method in statistical mechanics of one-dimensional interacting units: efficient iterative algorithmic procedures. Biopolymers, 30, 481–497.
-
- Watson J.D. and Crick,F.H.C. (1953) Molecular structure of nucleic acids. A structure for deoxyribose nucleic acid. Nature, 171, 737–738. - PubMed
-
- Fixman M. and Freire,J.J. (1977) Theory of DNA melting curves. Biopolymers, 16, 2693–2704. - PubMed
Publication types
MeSH terms
Substances
LinkOut - more resources
Full Text Sources
Medical
Molecular Biology Databases
