

Building protein diagrams on the web with the residue-based diagram editor RbDe
- PMID: 12824436
- PMCID: PMC168959
- DOI: 10.1093/nar/gkg552
Building protein diagrams on the web with the residue-based diagram editor RbDe
Abstract
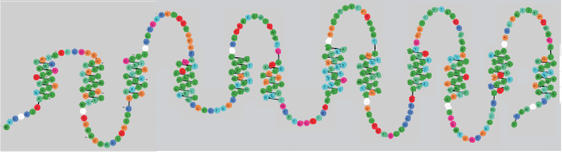
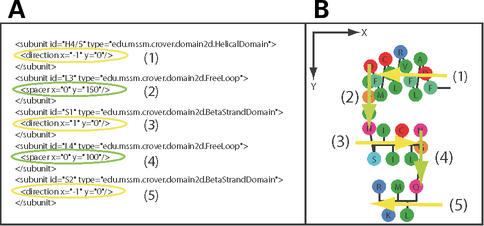
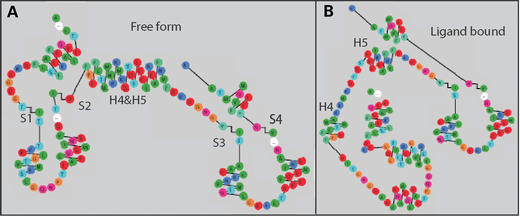
The residue-based diagram editor (RbDe) is web-based software that greatly simplifies the construction of schematic diagrams of proteins. Residue-based diagrams display the sequence of a given protein in the context of its secondary and tertiary structure. Such diagrams are frequently used to summarize mutations or sequence features, in the context of the overall topology of a protein. The initial version of RbDe was designed for transmembrane proteins and has enabled many users to create diagrams of large systems such as G protein-coupled receptors or transporters. We present an extended diagram editor that supports other families of proteins. Users can now import custom-diagram layouts, use them to render members of any protein family and generate high-quality output for publication purposes. RbDe is available free over the web, at http://icb.mssm.edu/crt/RbDe
Figures

References
-
- Campagne F., Jestin,R., Reversat,J.L., Bernassau,J.M. and Maigret,B. (1999) Visualisation and integration of G protein-coupled receptor related information help the modelling: description and applications of the Viseur program. J. Comput. Aided Mol. Des., 13, 625–643. - PubMed
-
- Konvicka K., Campagne,F. and Weinstein,H. (2000) Interactive construction of residue-based diagrams of proteins: the RbDe web service. Protein Eng., 13, 395–396. - PubMed
-
- Campagne F. (1995) The Viseur Program. http://transport.physbio.mssm.edu/viseur. Laboratoire de Chimie Theorique, Nancy, France.
-
- Campagne F. and Weinstein,H. (1999) Schematic representation of residue-based protein context-dependent data: an application to transmembrane proteins. J. Mol. Graph. Model., 17, 207–213. - PubMed
-
- Lin W.J. and Hwang,M.J. (1998) VHMPT: a graphical viewer and editor for helical membrane protein topologies. Bioinformatics, 14, 866–868. - PubMed
Publication types
MeSH terms
Substances
Associated data
- Actions
- Actions
Grants and funding
LinkOut - more resources
Full Text Sources
Research Materials
