

cAMP-independent olfactory transduction of amino acids in Xenopus laevis tadpoles
- PMID: 12824450
- PMCID: PMC2343148
- DOI: 10.1113/jphysiol.2003.043059
cAMP-independent olfactory transduction of amino acids in Xenopus laevis tadpoles
Abstract
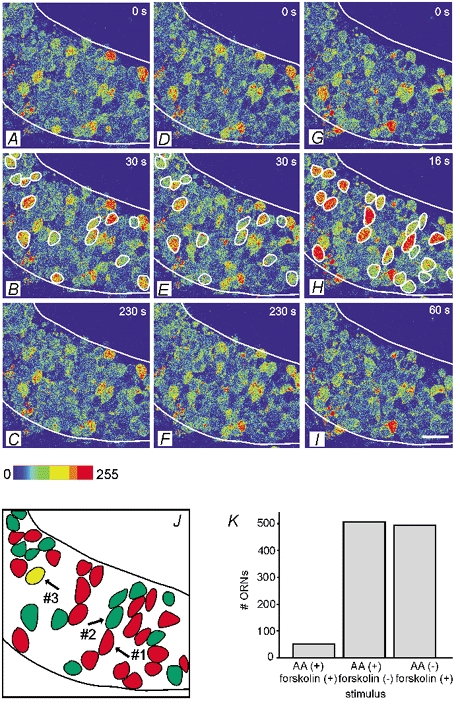
Whether odorants are transduced by only one or more than one second messenger has been a long-standing question in olfactory research. In a previous study we started to address this question mainly by using calcium imaging in the olfactory bulb. Here, we present direct evidence for our earlier conclusions using the calcium imaging technique in the mucosa slice. The above question can now unambiguously be answered. We show that some olfactory receptor neurons (ORNs) respond to stimulation with amino acids with an increase of the intracellular calcium concentration [Ca2+]i. In order to see whether or not these responses were mediated by the cAMP transduction pathway we applied forskolin or the membrane-permeant cAMP analogue pCPT-cAMP to the olfactory epithelium. The ensemble of ORNs that was activated by amino acids markedly differed from the ensemble of neurons activated by forskolin or pCPT-cAMP. Less than 6 % of the responding ORNs showed a response to both amino acids and the pharmacological agents activating the cAMP transduction pathway. We conclude that ORNs of Xenopus laevis tadpoles have both cAMP-dependent and cAMP-independent olfactory transduction pathways and that most amino acids are transduced in a cAMP-independent way.
Figures

Similar articles
-
Classes and narrowing selectivity of olfactory receptor neurons of Xenopus laevis tadpoles.J Gen Physiol. 2004 Feb;123(2):99-107. doi: 10.1085/jgp.200308970. J Gen Physiol. 2004. PMID: 14744986 Free PMC article.
-
cAMP-independent responses of olfactory neurons in Xenopus laevis tadpoles and their projection onto olfactory bulb neurons.J Physiol. 2002 Dec 1;545(2):475-84. doi: 10.1113/jphysiol.2002.031914. J Physiol. 2002. PMID: 12456827 Free PMC article.
-
ATP activates both receptor and sustentacular supporting cells in the olfactory epithelium of Xenopus laevis tadpoles.Eur J Neurosci. 2006 Jan;23(1):119-28. doi: 10.1111/j.1460-9568.2005.04533.x. Eur J Neurosci. 2006. PMID: 16420422
-
Transduction mechanisms in vertebrate olfactory receptor cells.Physiol Rev. 1998 Apr;78(2):429-66. doi: 10.1152/physrev.1998.78.2.429. Physiol Rev. 1998. PMID: 9562035 Review.
-
Signal transduction in olfactory neurons.J Steroid Biochem Mol Biol. 1991 Oct;39(4B):633-7. doi: 10.1016/0960-0760(91)90262-4. J Steroid Biochem Mol Biol. 1991. PMID: 1654079 Review.
Cited by
-
A new challenge-development of test systems for the infochemical effect.Environ Sci Pollut Res Int. 2009 Jun;16(4):370-88. doi: 10.1007/s11356-008-0093-1. Epub 2009 Feb 3. Environ Sci Pollut Res Int. 2009. PMID: 19189145 Review.
-
Olfaction across the water-air interface in anuran amphibians.Cell Tissue Res. 2021 Jan;383(1):301-325. doi: 10.1007/s00441-020-03377-5. Epub 2021 Jan 26. Cell Tissue Res. 2021. PMID: 33496878 Free PMC article. Review.
-
Odors detected by mice deficient in cyclic nucleotide-gated channel subunit A2 stimulate the main olfactory system.J Neurosci. 2004 Apr 7;24(14):3703-10. doi: 10.1523/JNEUROSCI.0188-04.2004. J Neurosci. 2004. PMID: 15071119 Free PMC article.
-
Classes and narrowing selectivity of olfactory receptor neurons of Xenopus laevis tadpoles.J Gen Physiol. 2004 Feb;123(2):99-107. doi: 10.1085/jgp.200308970. J Gen Physiol. 2004. PMID: 14744986 Free PMC article.
-
Interhemispheric asymmetry of c-Fos expression in glomeruli and the olfactory tubercle following repeated odor stimulation.FEBS Open Bio. 2020 May;10(5):912-926. doi: 10.1002/2211-5463.12851. Epub 2020 Apr 13. FEBS Open Bio. 2020. PMID: 32237058 Free PMC article.
References
-
- Abrahamse SL, Rechkemmer G. Identification of an organic anion transport system in the human colon carcinoma cell line HT29 clone 19A. Pflugers Arch. 2001;441:529–537. - PubMed
-
- Belluscio L, Gold GH, Nemes A, Axel R. Mice deficient in G(olf) are anosmic. Neuron. 1998;20:69–81. - PubMed
-
- Breer H, Boekhoff I. Odorants of the same odor class activate different second messenger pathways. Chem Senses. 1991;16:19–29.
-
- Brunet LJ, Gold GH, Ngai J. General anosmia caused by a targeted disruption of the mouse olfactory cyclic nucleotide-gated cation channel. Neuron. 1996;17:681–693. - PubMed
MeSH terms
Substances
LinkOut - more resources
Full Text Sources
Miscellaneous