. 2003 Jul 8;100(14):8124-9.
doi: 10.1073/pnas.0832439100. Epub 2003 Jun 24.

Dynamics of the Neoproterozoic carbon cycle

Affiliations

Dynamics of the Neoproterozoic carbon cycle

Daniel H Rothman et al. Proc Natl Acad Sci U S A. .

Abstract

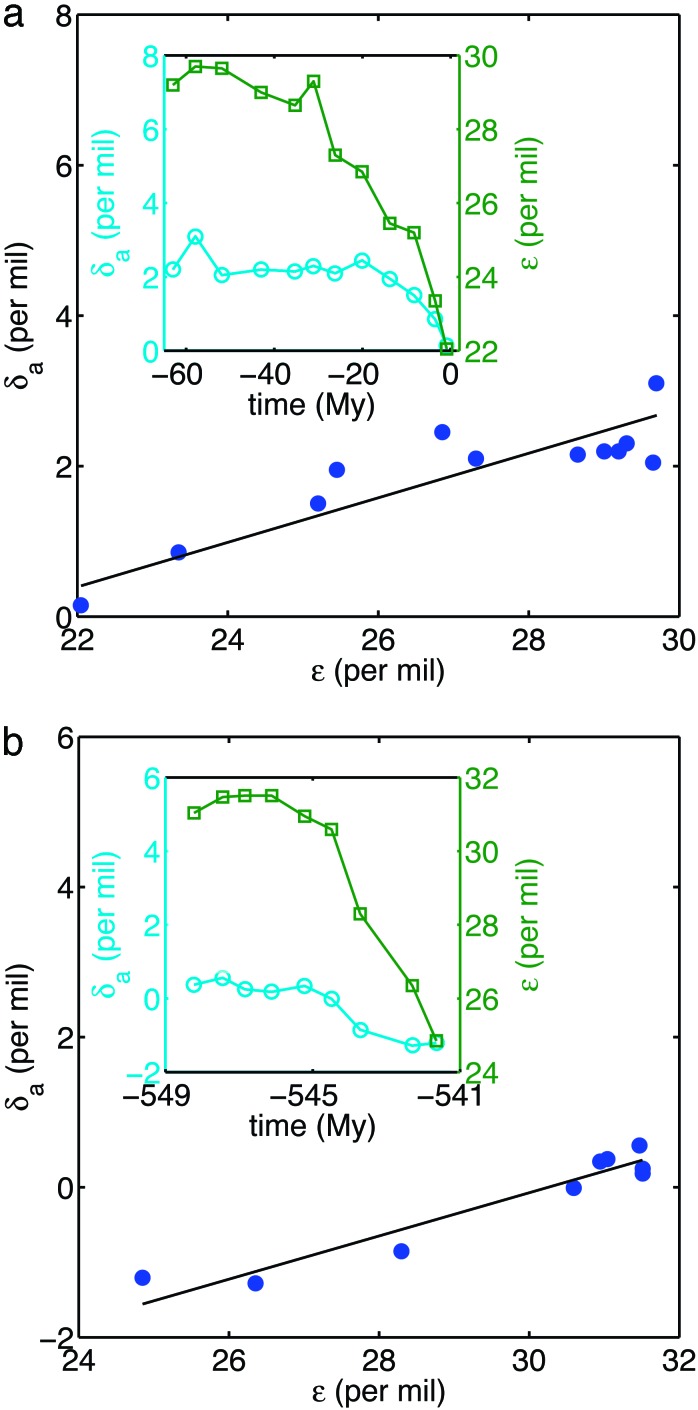
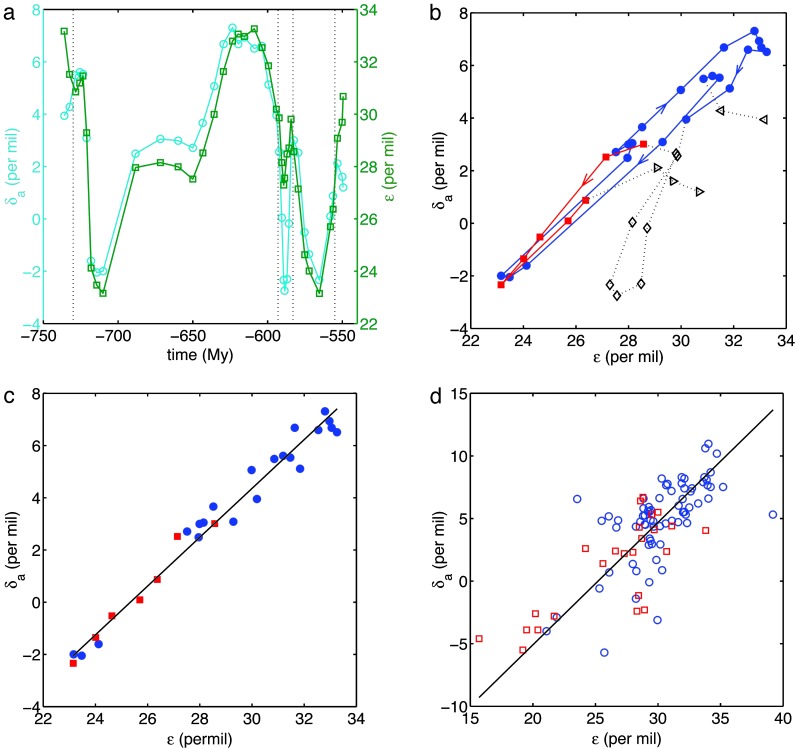
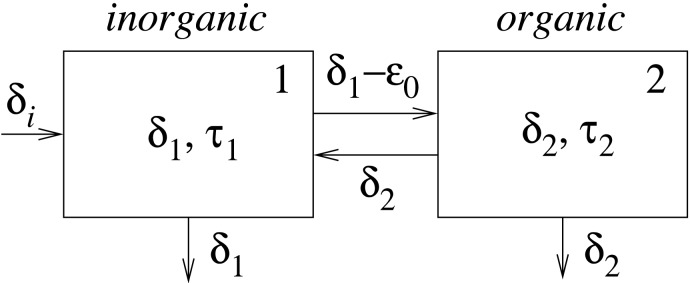
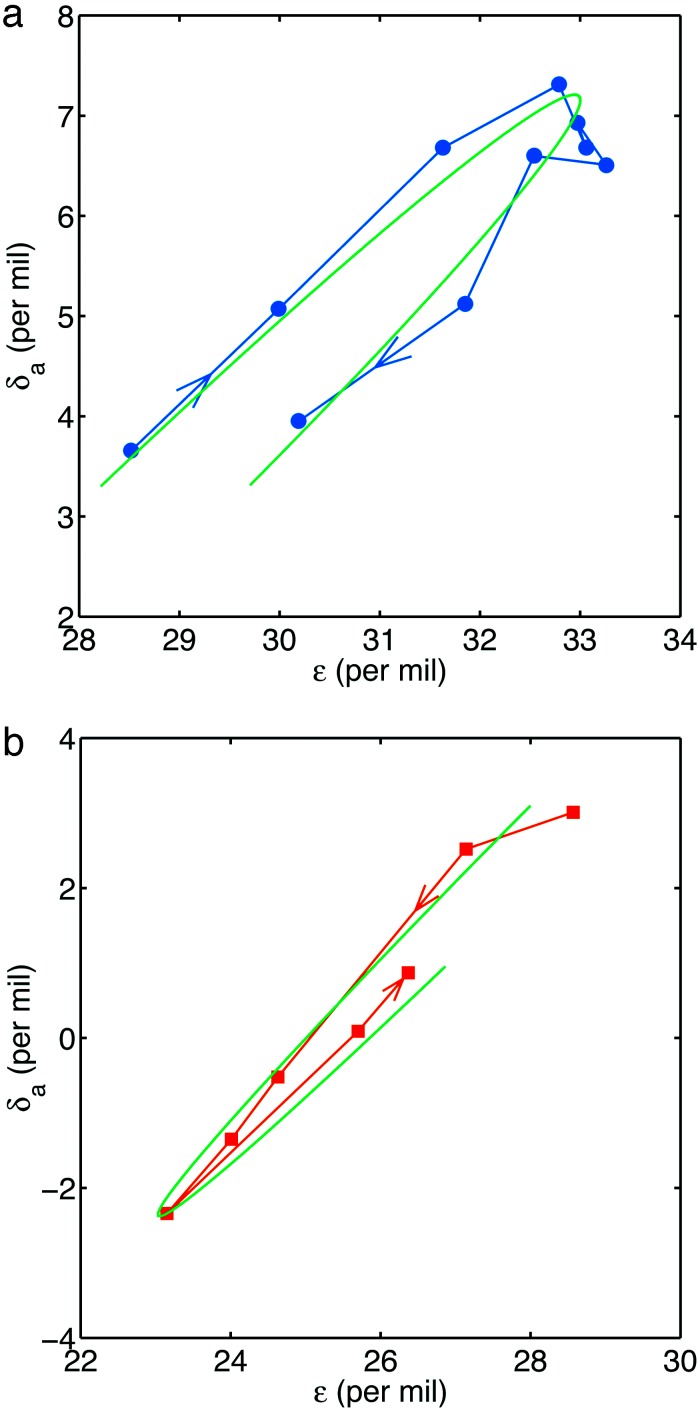
The existence of unusually large fluctuations in the Neoproterozoic (1,000-543 million years ago) carbon-isotopic record implies strong perturbations to the Earth's carbon cycle. To analyze these fluctuations, we examine records of both the isotopic content of carbonate carbon and the fractionation between carbonate and marine organic carbon. Together, these are inconsistent with conventional, steady-state models of the carbon cycle. The records can be well understood, however, as deriving from the nonsteady dynamics of two reactive pools of carbon. The lack of a steady state is traced to an unusually large oceanic reservoir of organic carbon. We suggest that the most significant of the Neoproterozoic negative carbon-isotopic excursions resulted from increased remineralization of this reservoir. The terminal event, at the Proterozoic-Cambrian boundary, signals the final diminution of the reservoir, a process that was likely initiated by evolutionary innovations that increased export of organic matter to the deep sea.


Figures

Fig. 1.
Fig. 1.
(a) The isotopic content of carbonate carbon (δa) vs. the fractionation between carbonate and marine organic carbon (ε) for the Cenozoic along with the best-fitting straight line [the reduced major axis (16)]. The slope of the line is = 0.30, with 95% confidence interval [0.18, 0.36]; its intercept is δ̂i = -6.1‰ [-7.6‰, -2.8‰] (r = 0.88, n = 12). Confidence intervals are computed by using the bootstrap method (33). (Inset) Time dependence of δa (cyan ○) and ε (green □). (b) The same analysis for a more highly resolved period in the latest Precambrian and early Cambrian, resulting in = 0.29 [0.23, 0.43] and δ̂i = -8.7‰ [-13.2‰, -7.1‰] (r = 0.96, n = 9). The data, from ref. , are computed from global averages. The average standard deviations of these mean values are 0.3‰ (δa) and 0.9‰ (ε) in a and 0.1‰ (δa) and 0.8‰ (ε) in b.
Fig. 2.
Fig. 2.
(a) Time dependence of δa (cyan ○) and ε (green □) in the Neoproterozoic computed from global averages (15); the mean standard deviations are 0.6‰ (δa) and 1.0‰ (ε). Dotted lines correspond to t = 730, 593, 583, and 555 Ma. (b) Corresponding trajectories in the ε, δa phase plane. Arrows indicate the direction of time. Symbols correspond to the following time intervals: ◃, 738–730 Ma; blue •, 730–593 Ma; ⋄, 593–583 Ma; red ▪, 583–555 Ma; ▹, 555–549 Ma. (c) The data from b corresponding only to its blue and red intervals, compared with the best-fitting straight line. The slope = 0.94 [0.88,0.98] and the intercept δ̂i = -23.7‰ [-25.0‰, -22.2‰](r = 0.99, n = 28). (d) The complete set of unaveraged ε, δa pairs that occur within the same rock sample and contribute to the mean values plotted in c, compared with the best-fitting straight line. The slope = 0.98 [0.85, 1.15] and the intercept δ̂i = -24.6‰ [-30.0‰, -20.7‰](r = 0.76, n = 98). Time intervals: blue ○, 731–590 Ma; red □, 583–553 Ma.
Fig. 3.
Fig. 3.
A carbon-cycle model with two time scales, τ1 and τ2. Reservoir 1 denotes the inorganic carbon of the oceans, with isotopic content δ1; reservoir 2 denotes organic carbon, with isotopic content δ2. Fluxes between reservoirs represent photosynthesis (including isotopic depletion by an amount ε0) and remineralization; fluxes out of the reservoirs represent burial. The flux into reservoir 1 represents volcanic and other inputs with isotopic content δi.
Fig. 4.
Fig. 4.
Neoproterozoic observations compared with theory. (a) The positive excursion between 645 and 594 Ma (blue circles; compare with Fig. 2 a and b) compared with approximately one-half cycle in the evolution of Eqs. 6–9 (smooth green line), with ε0 varying according to Eq. 15. The control parameter μ = 10-2. Both trajectories flow in the same clockwise direction. (b) The negative excursion between 583 and 555 Ma (red squares; compare with Fig. a and b) compared with theory (smooth green line), where now ε0 is constant but the remineralization flux varies according to Eq. 16. Once again μ = 10-2. Both trajectories flow in the counterclockwise direction.

References

    1. Des Marais, D. J. (1997) in Geomicrobiology: Interactions Between Microbes and Minerals, eds. Banfield, J. F & Nealson, K. H. (Mineralogical Society of America, Washington, DC), pp. 429-448.
    1. Freeman, K. H. (2001) in Stable Isotope Geochemistry, eds. Valley, J. W & Cole, D. R. (Mineralogical Soc. of America, Washington, DC), pp. 589-606.
    1. Magaritz, M., Holser, W. T. & Kirschvink, J. L. (1986) Nature 320 258-259.
    1. Kimura, H., Matsumoto, R., Kakuwa, Y., Hamdi, B. & Zibaseresht, H. (1997) Earth Planet. Sci. Lett. 147 E1-E7.
    1. Bartley, J. K., Pope, M., Knoll, A. H., Semikhatov, M. A. & Petrov, P. Y. (1998) Geol. Mag. 135 473-494. - PubMed

Publication types

LinkOut - more resources