

Neural correlates of interindividual differences in the subjective experience of pain
- PMID: 12824463
- PMCID: PMC166264
- DOI: 10.1073/pnas.1430684100
Neural correlates of interindividual differences in the subjective experience of pain
Erratum in
-
Correction for Coghill et al., Neural correlates of interindividual differences in the subjective experience of pain.Proc Natl Acad Sci U S A. 2017 Nov 28;114(48):E10507. doi: 10.1073/pnas.1719365114. Epub 2017 Nov 20. Proc Natl Acad Sci U S A. 2017. PMID: 29158410 Free PMC article. No abstract available.
Abstract
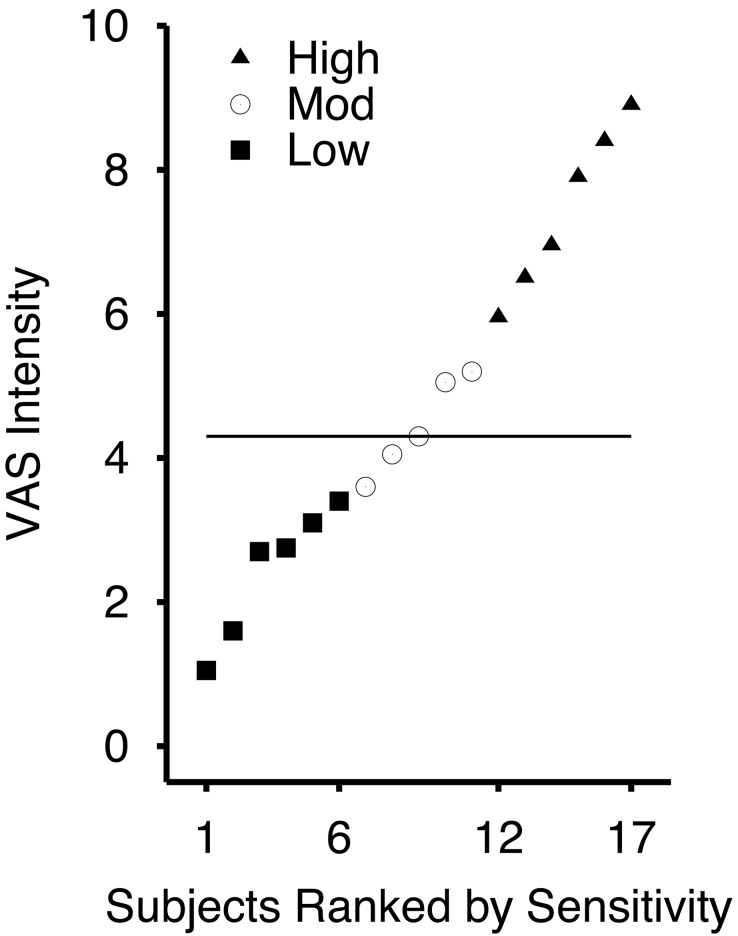
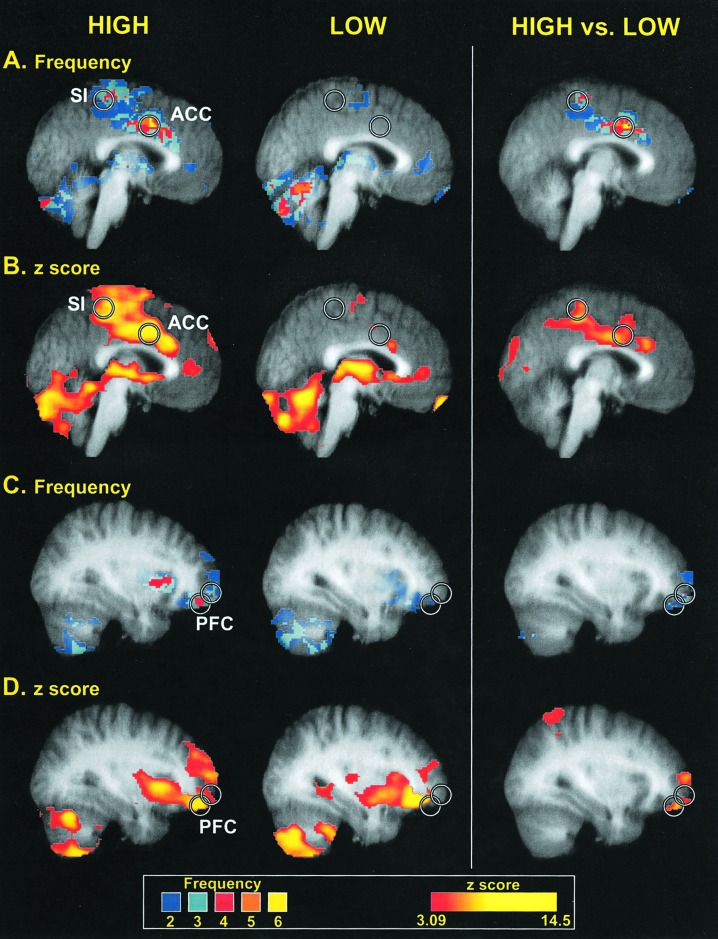
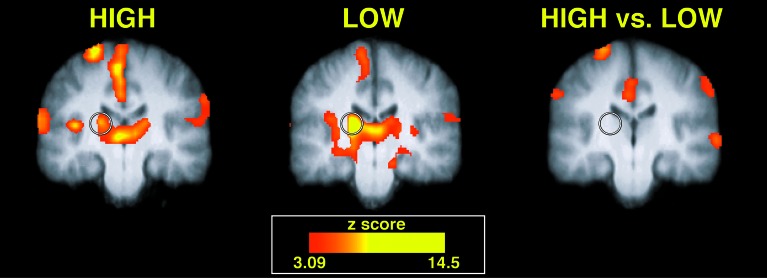
Some individuals claim that they are very sensitive to pain, whereas others say that they tolerate pain well. Yet, it is difficult to determine whether such subjective reports reflect true interindividual experiential differences. Using psychophysical ratings to define pain sensitivity and functional magnetic resonance imaging to assess brain activity, we found that highly sensitive individuals exhibited more frequent and more robust pain-induced activation of the primary somatosensory cortex, anterior cingulate cortex, and prefrontal cortex than did insensitive individuals. By identifying objective neural correlates of subjective differences, these findings validate the utility of introspection and subjective reporting as a means of communicating a first-person experience.
Figures
References
-
- Chalmers, D. J. (1996) The Conscious Mind (Oxford Univ. Press, New York).
-
- Price, D. D. (1999) Psychological Mechanisms of Pain and Analgesia (Int. Assoc. for the Study of Pain, Seattle).
-
- Rosier, E. M., Iadarola, M. J. & Coghill, R. C. (2002) Pain 98, 205-216. - PubMed
-
- Stevens, S. S. (1975) Psychophysics (Wiley, New York).
-
- Price, D. D., Bush, F. M., Long, S. & Harkins, S. W. (1994) Pain 56, 217-226. - PubMed
Publication types
MeSH terms
Grants and funding
LinkOut - more resources
Full Text Sources
Other Literature Sources
Medical
