Comparative Study
. 2003 Jul 8;100(14):8235-40.
doi: 10.1073/pnas.1433105100. Epub 2003 Jun 24.

Fluorescence bleaching reveals asymmetric compartment formation prior to cell division in Caulobacter

Affiliations
Comparative Study

Fluorescence bleaching reveals asymmetric compartment formation prior to cell division in Caulobacter

Ellen M Judd et al. Proc Natl Acad Sci U S A. .

Abstract

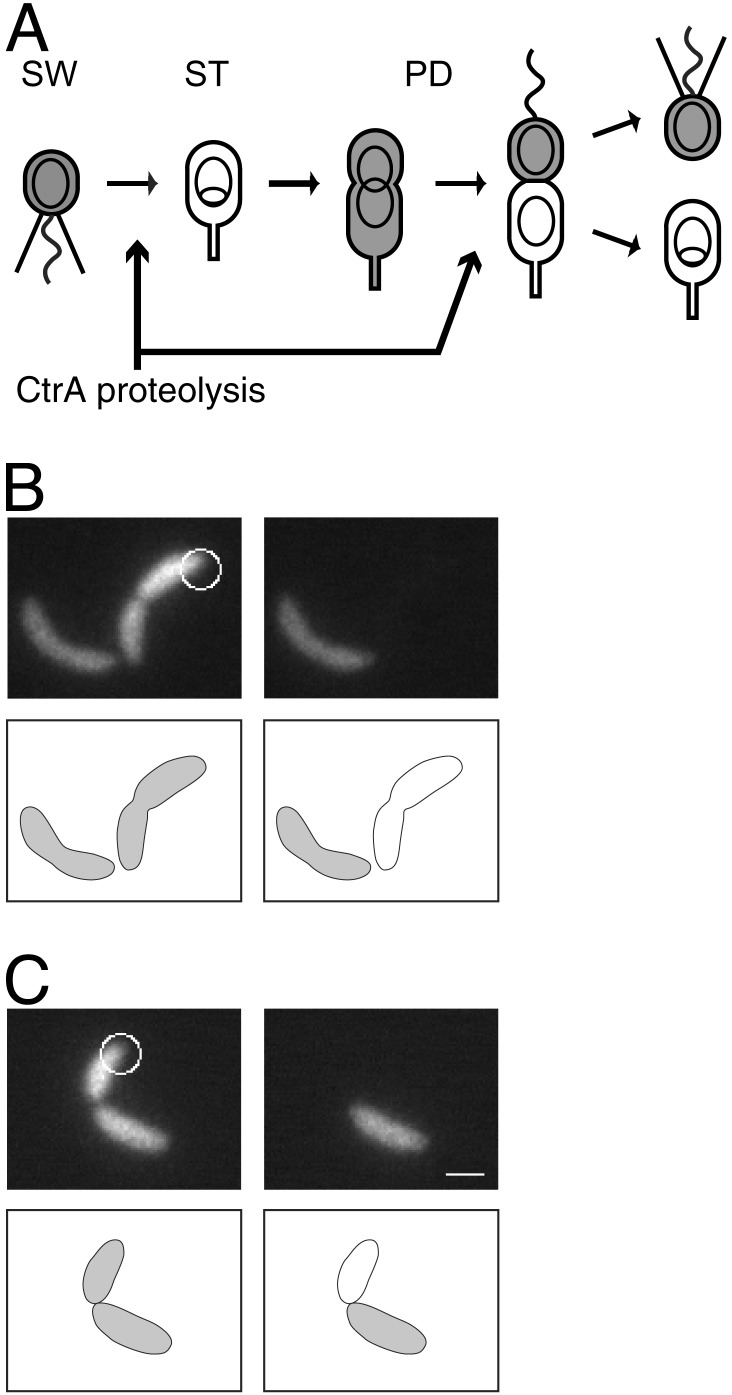
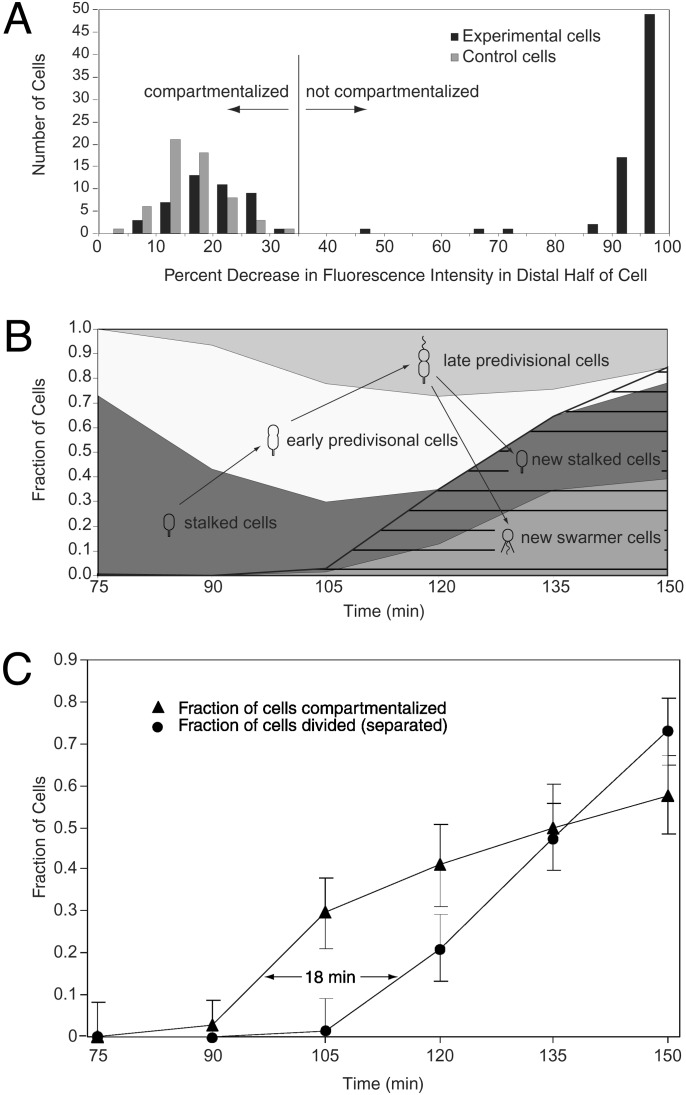
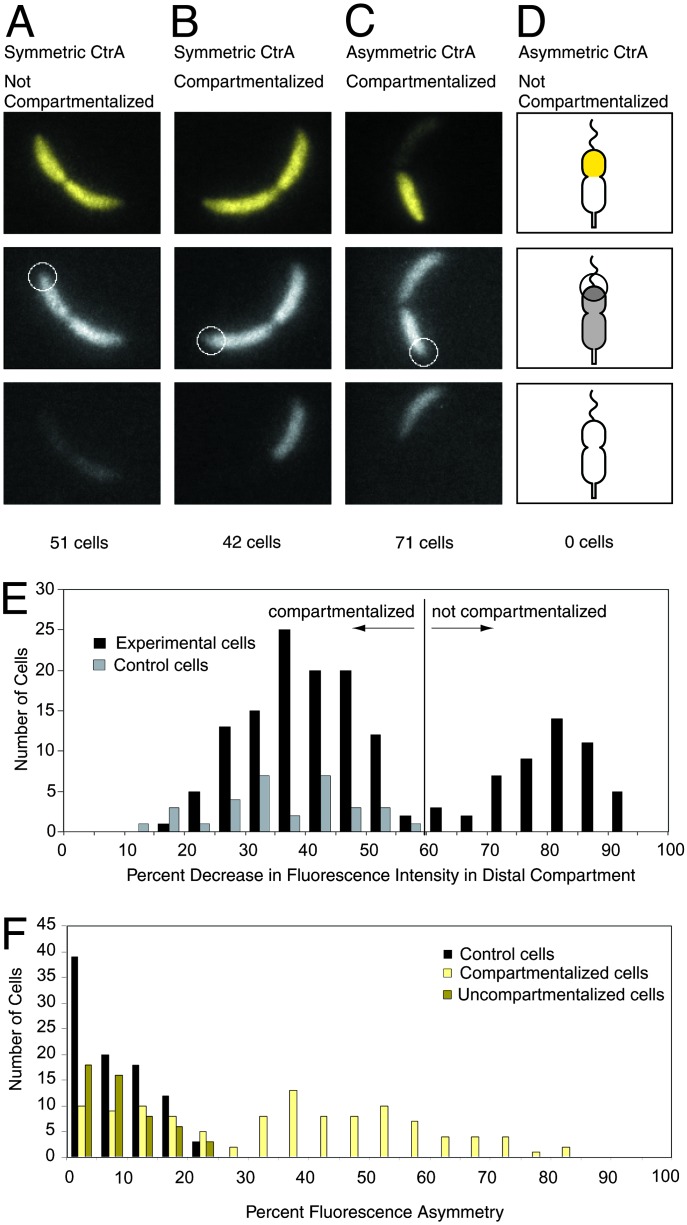
Asymmetric cell division in Caulobacter crescentus yields daughter cells that have different cell fates. Compartmentalization of the predivisional cell is a critical event in the establishment of the differential distribution of regulatory factors that specify cell fate. To determine when during the cell cycle the cytoplasm is compartmentalized so that cytoplasmic proteins can no longer diffuse between the two nascent progeny cell compartments, we designed a fluorescence loss in photobleaching assay. Individual cells containing enhanced GFP were exposed to a bleaching laser pulse tightly focused at one cell pole. In compartmentalized cells, fluorescence disappears only in the compartment receiving the bleaching beam; in noncompartmentalized cells, fluorescence disappears from the entire cell. In a 135-min cell cycle, the cells were compartmentalized 18 +/- 5 min before the progeny cells separated. Clearance of the 22000 CtrA master transcriptional regulator molecules from the stalked portion of the predivisional cell is a controlling element of Caulobacter asymmetry. Monitoring of a fluorescent marker for CtrA showed that the differential degradation of CtrA in the nascent stalk cell compartment occurs only after the cytoplasm is compartmentalized.


Figures

Fig. 1.
Fig. 1.
(A) C. crescentus cell cycle. The motile swarmer cell (SW) has a polar flagellum (wavy line) and pili (straight lines), contains the CtrA protein (gray shading), and does not replicate its DNA (nonreplicating DNA represented as a ring). During differentiation into a stalked cell (ST), the flagellum is shed and a stalk is built at the same pole, CtrA is proteolyzed, and DNA replication initiates (theta structure). CtrA accumulates in the predivisional cell (PD), then is cleared from the stalked compartment of the late PD cell. The PD cell divides to yield a SW cell and a ST cell. (B and C) Two representative FLIP experiment results demonstrating the absence (B) and the presence (C) of compartmentalization. (B) A fluorescence image of a C. crescentus cell expressing EGFP, before (Left) and 2 sec after (Right) photobleaching. The cellwide loss of fluorescence indicates that this cell is not yet compartmentalized. (C) The same experiment performed on a different cell. In this case, retention of fluorescence in the portion of the cell distal to the focused laser beam shows that this cell is compartmentalized. White circles, focused laser used for bleaching. The diameter of the circles corresponds to the full width half maximum size of the laser beam. (Scale bar = 1 μm.)
Fig. 2.
Fig. 2.
(A) Histogram of decrease in average fluorescence intensity of the distal portion of the cell after the bleaching pulse (ΔId), for strain LS3008. Experimental cells were bleached with a laser focused at one pole, as in Fig. 1. Control cells were treated identically, except that the laser was focused ≈1.5 μm to the side of the cell. Cells with ΔId < 35% were said to be compartmentalized. (B) Fraction of swarmer cells, stalked cells, and early and late predivisional cells present in the synchronized population as a function of time. Cell type was determined by morphology (see Supporting Materials and Methods). Seventy-five minutes into the cell cycle, the population consists primarily of stalked cells. As the cell cycle progresses, stalked cells develop into predivisional cells, which then divide to form new swarmer and stalked cells (hatching). (C) Time lag between compartmentalization and cell division. Triangles show the fraction of cells that are compartmentalized. Circles show the fraction of the originally isolated swarmer cells that have completed cell division and separated into two progeny cells (Fd). Fd = Nd/2(Nt - Nd/2), where Nd is the number of divided cells counted and Nt is the total number of cells counted. This equation corrects for the fact that, after a cell has divided, it will be counted as two cells. Each point on the “compartmentalized” curve is calculated from measurements on 22–34 cells, except the 75-min time point (14 cells). Error bars show the standard deviation of the binomial distribution (33). Each point on the “divided” curve is based on at least 300 cells. Error bars on these points show an estimate of the error due to cells whose stage in the cell cycle cannot be unambiguously determined based on their morphology.
Fig. 3.
Fig. 3.
Simultaneous observation of compartmentalization and asymmetric CtrA localization. (AC) Representative images. (Top) Images are false colored; yellow images represent signal from YFP-CtrA RD + 15. (Middle and Bottom) Gray images represent signal from cytoplasmic mRFP1.1. (Top and Middle) Images were taken before bleaching. White circles show the placement of the focused laser used for bleaching. The diameter of the circles is 1 μm, corresponding to the full width half maximum size of the laser beam. (Bottom) Images show the same cells after bleaching. (D) Schematic showing the expected results from a cell that had asymmetric CtrA but no diffusion barrier. We did not observe any cells of this type. (E) Histogram of decrease in red fluorescence intensity of the distal portion of the cell after the bleaching pulse (ΔId) for strain EJ188. Experimental cells were treated with the FLIP assay in the two-color compartmentalization/CtrA degradation experiment as shown in AD. Control cells were treated identically, except that the laser was focused ≈1.5 μm to the side of the cell. Cells with ΔId < 60% were said to be compartmentalized. (F) Histogram of fluorescence asymmetry. Percent fluorescence asymmetry is defined as Af = (Ibright - Idim)/Ibright, where Ibright and Idim are the average fluorescence intensities of the bright and dim compartments of the cell, respectively. Experimental cells are strain EJ188. Af for the experimental cells was calculated by using the yellow fluorescence signal from the YFP-CtrA RD + 15 fusion protein. Control cells are strain LS3008, containing cytoplasmic EGFP. Af for the control cells was calculated by using the green fluorescence signal from EGFP. EJ188 cells with Af > 25% were said to have asymmetric CtrA.

Similar articles

Cited by

References

    1. Ryan, K. R. & Shapiro, L. (2003) Annu. Rev. Biochem. 72 367-394. - PubMed
    1. Shapiro, L., McAdams, H. H. & Losick, R. (2002) Science 298 1942-1946. - PubMed
    1. Poindexter, J. S. & Hagenzieker, J. G. (1981) Can. J. Microbiol. 27 704-719. - PubMed
    1. Quardokus, E., Din, N. & Brun, Y. V. (1996) Proc. Natl. Acad. Sci. USA 93 6314-6319. - PMC - PubMed
    1. Quardokus, E. M., Din, N. & Brun, Y. V. (2001) Mol. Microbiol. 39 949-959. - PubMed

Publication types

MeSH terms

LinkOut - more resources