. 2003 Jun 26:4:5.
doi: 10.1186/1471-2172-4-5. Epub 2003 Jun 26.

Genetic control of the innate immune response

Affiliations

Genetic control of the innate immune response

Christine A Wells et al. BMC Immunol. .

Abstract

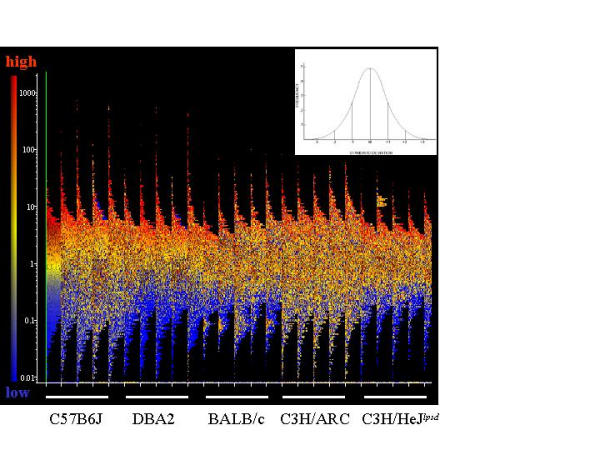
Background: Susceptibility to infectious diseases is directed, in part, by the interaction between the invading pathogen and host macrophages. This study examines the influence of genetic background on host-pathogen interactions, by assessing the transcriptional responses of macrophages from five inbred mouse strains to lipopolysaccharide (LPS), a major determinant of responses to gram-negative microorganisms.

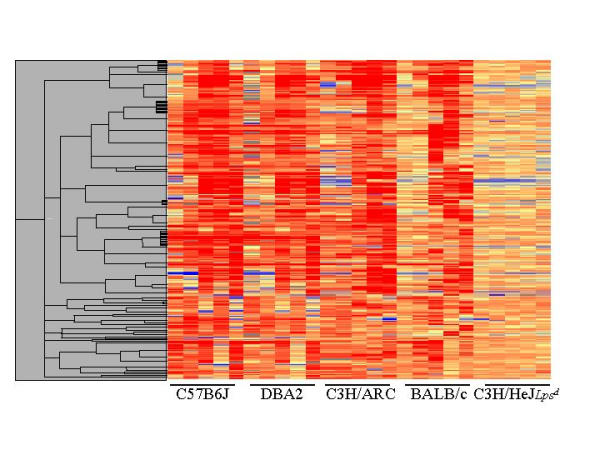
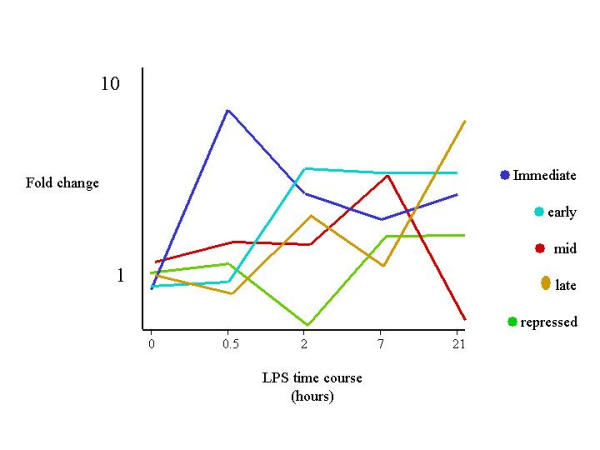
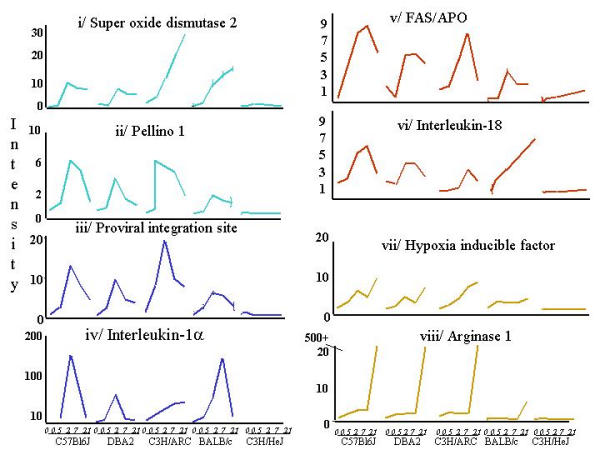
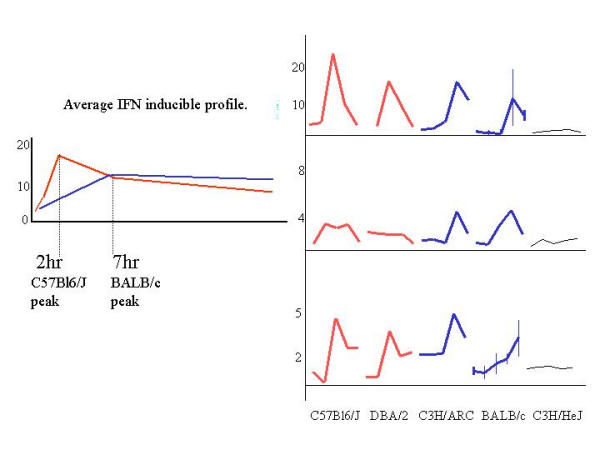
Results: The mouse strains examined varied greatly in the number, amplitude and rate of induction of genes expressed in response to LPS. The response was attenuated in the C3H/HeJlpsd strain, which has a mutation in the LPS receptor Toll-like receptor 4 (TLR4). Variation between mouse strains allowed clustering into early (C57Bl/6J and DBA/2J) and delayed (BALB/c and C3H/ARC) transcriptional phenotypes. There was no clear correlation between gene induction patterns and variation at the Bcg locus (Slc11A1) or propensity to bias Th1 versus Th2 T cell activation responses.

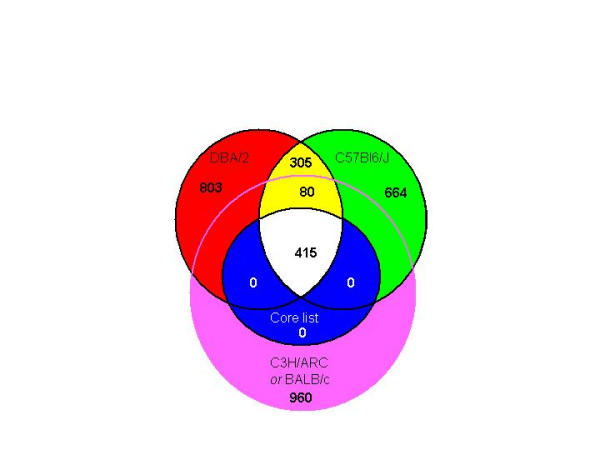
Conclusion: Macrophages from each strain responded to LPS with unique gene expression profiles. The variation apparent between genetic backgrounds provides insights into the breadth of possible inflammatory responses, and paradoxically, this divergence was used to identify a common transcriptional program that responds to TLR4 signalling, irrespective of genetic background. Our data indicates that many additional genetic loci control the nature and the extent of transcriptional responses promoted by a single pathogen-associated molecular pattern (PAMP), such as LPS.


Figures

Figure 1
Figure 1
Temporal distribution of the entire 19,000 RIKEN cDNA dataset. Figure 1 describes the distribution of expression of 19,000 RIKEN full-length cDNAs across a 21-hour time course for each of 5 mouse strains, C57Bl/6J, DBA2, BALB/c, C3H/Arc and C3H/HeJlpsd. A normal distribution plot allows standard deviations (SD) from the mean of the population to be calculated (inset). The graph describes a series of overlaid normal distribution plots; each time point is plotted as a normal distribution of signal intensities on the y-axis, frequency on the x-axis, with a log median intensity of 1 across the dataset. Each element is coloured with respect to its expression in the unstimulated C57Bl/6J time point, where blue is expressed at least 2SD below the median, yellow is considered within 2SD of the median and red is at least 2SD above the median.
Figure 2
Figure 2
Hierarchical clustering of the core transcriptional program. Unsupervised hierarchical clustering of 415 elements that were determined to be co-induced across the time course in all responder mouse strains tested, but not in the Tlr4-null mice C3H/HeJlpsd. The temporal samples (from left to right 0, 0.5, 2, 7, 21 h) for each strain are shown as columns across the X-axis, and each row on the Y-axis represents a single cDNA. The colour indicates expression levels of the cDNAs, where blue is low expression, red is high expression, and yellow is the same expression relative to the embryo control.
Figure 3
Figure 3
Functional classification of the core transcriptional program The core inflammatory program consisted of 383 unique transcripts including 146 with no known function. 237 known genes were annotated using GO terms, and the results displayed as a pie graph. Genes were classified into the following groups: cytoskeleton (pink, 43 genes); growth and differentiation (navy, 35 genes); phagocytosis (lavender, 33 genes); cell signalling pathways (blue, 32 genes); transcription (orange, 26 genes); cytokine or chemokine (aubergine, 19 genes); oxidative stress (aqua, 14 genes); apoptosis/ anti-apoptosis (yellow, 13 genes); antigen presentation (maroon, 12 genes) and lipid metabolism (pale blue, 9 genes).
Figure 4
Figure 4
Temporal profiling of the core transcriptional program. Temporal clustering of the inflammatory template by Principal Component Analysis (PCA) revealed a highly regulated set with early (30 min–2 hours), mid (2–7 hours) and late (21 hours) onset of gene induction. Average relative intensity of expression is displayed on the Y-axis, time in hours on the x-axis.
Figure 5
Figure 5
Temporal profiling of the core transcriptional program. The profiles of 8 key genes representing each temporal cluster. Immediate (30 min peak) IL1α, SOD2, Pellino and EVI Early (2 hr peak) IL18, FAS; Late (24 hr peak) Hif1α, Arginase I.
Figure 6
Figure 6
Genomic clustering of conserved LPS inducible transcripts. Full length cDNA sequences corresponding to the conserved LPS responsive set were mapped to the mouse genome using the BLAST function of the FANTOM2 server at Map positions (in base pairs) were plotted against the position of chromosome band boundaries to identify sequences mapping within the same chromosomal region. Chromosomes 2 and 17 are given as examples, the remaining data may be found in the supplementary information accompanying this paper.
Figure 7
Figure 7
The distribution of LPS-responsive transcripts between mouse strains. Venn Diagram showing the number of LPS-responsive elements shared between the 4 LPSn mouse strains. 960 were inducible in C3H/ARC and/or BALB/c alone, 803 were expressed in DBA/2 alone and 664 were expressed in C57Bl/6J alone. 415 elements were expressed in all 4 LPS-responsive strains. 80 transcripts were expressed in 3 of the 4 LPS responsive strains, including C57Bl6J and DBA/2. 305 elements were shared only between DBA and C57Bl/6J.
Figure 8
Figure 8
The sensitisation of interferon-responsive transcripts in C57Bl6J mice. The averaged temporal profile of 13 interferon-responsive genes compared between C57Bl/6J and BALB/c mice, where the Y axis represents the fold induction from the unstimulated timepoint and the X-Axis categorises the time points for both mouse strains. The C57Bl6/J profile (red) is induced by 2 hours, whereas the BALB/c profile is delayed at 7hours. This segregation of temporal induction was observed in 18 genes within the conserved TLR4-dependent set, and 3 examples are given: A/ Isg20; B/ Ifi56 and C/ Gbp2 for all 5 mouse strains.
Figure 9
Figure 9
Genomic clustering of transcripts differentially expressed between C57Bl/6J and BALB/c mice. Full-length cDNA sequences corresponding to the 436 transcripts identified as significantly (p = 0.05) differentially expressed were mapped to the mouse genome using the BLAST function of the FANTOM2 server at . The chromosome locations are graphed as frequency (number of transcripts) vs Chromosome number.
Figure 10
Figure 10
Genomic clustering of transcripts differentially expressed between C57Bl/6J and BALB/c mice. Sixty-one transcripts mapped to chromosome 11. The graph plots frequency (number of transcripts) vs Mb (x-axis).

Similar articles

Cited by

  • Pulmonary responses to Stachybotrys chartarum and its toxins: mouse strain affects clearance and macrophage cytotoxicity.
    Lichtenstein JH, Molina RM, Donaghey TC, Amuzie CJ, Pestka JJ, Coull BA, Brain JD. Lichtenstein JH, et al. Toxicol Sci. 2010 Jul;116(1):113-21. doi: 10.1093/toxsci/kfq104. Epub 2010 Apr 12. Toxicol Sci. 2010. PMID: 20385656 Free PMC article.
  • A comparative encyclopedia of DNA elements in the mouse genome.
    Yue F, Cheng Y, Breschi A, Vierstra J, Wu W, Ryba T, Sandstrom R, Ma Z, Davis C, Pope BD, Shen Y, Pervouchine DD, Djebali S, Thurman RE, Kaul R, Rynes E, Kirilusha A, Marinov GK, Williams BA, Trout D, Amrhein H, Fisher-Aylor K, Antoshechkin I, DeSalvo G, See LH, Fastuca M, Drenkow J, Zaleski C, Dobin A, Prieto P, Lagarde J, Bussotti G, Tanzer A, Denas O, Li K, Bender MA, Zhang M, Byron R, Groudine MT, McCleary D, Pham L, Ye Z, Kuan S, Edsall L, Wu YC, Rasmussen MD, Bansal MS, Kellis M, Keller CA, Morrissey CS, Mishra T, Jain D, Dogan N, Harris RS, Cayting P, Kawli T, Boyle AP, Euskirchen G, Kundaje A, Lin S, Lin Y, Jansen C, Malladi VS, Cline MS, Erickson DT, Kirkup VM, Learned K, Sloan CA, Rosenbloom KR, Lacerda de Sousa B, Beal K, Pignatelli M, Flicek P, Lian J, Kahveci T, Lee D, Kent WJ, Ramalho Santos M, Herrero J, Notredame C, Johnson A, Vong S, Lee K, Bates D, Neri F, Diegel M, Canfield T, Sabo PJ, Wilken MS, Reh TA, Giste E, Shafer A, Kutyavin T, Haugen E, Dunn D, Reynolds AP, Neph S, Humbert R, Hansen RS, De Bruijn M, Selleri L, Rudensky A, Josefowicz S, Samstein R, Eichler EE, Orkin SH, Levasseur D, Papayannopoulou T, Chang KH, Skoultchi A, Gosh S, Disteche C, Treuting P,… See abstract for full author list ➔ Yue F, et al. Nature. 2014 Nov 20;515(7527):355-64. doi: 10.1038/nature13992. Nature. 2014. PMID: 25409824 Free PMC article.
  • Functional plasticity of macrophages: reversible adaptation to changing microenvironments.
    Stout RD, Suttles J. Stout RD, et al. J Leukoc Biol. 2004 Sep;76(3):509-13. doi: 10.1189/jlb.0504272. Epub 2004 Jun 24. J Leukoc Biol. 2004. PMID: 15218057 Free PMC article. Review.
  • The Interplay between Salmonella and Intestinal Innate Immune Cells in Chickens.
    Ijaz A, Veldhuizen EJA, Broere F, Rutten VPMG, Jansen CA. Ijaz A, et al. Pathogens. 2021 Nov 19;10(11):1512. doi: 10.3390/pathogens10111512. Pathogens. 2021. PMID: 34832668 Free PMC article. Review.
  • Host genetic background impacts modulation of the TLR4 pathway by RON in tissue-associated macrophages.
    Chaudhuri A, Wilson NS, Yang B, Paler Martinez A, Liu J, Zhu C, Bricker N, Couto S, Modrusan Z, French D, Cupp J, Ashkenazi A. Chaudhuri A, et al. Immunol Cell Biol. 2013 Aug;91(7):451-60. doi: 10.1038/icb.2013.27. Epub 2013 Jul 2. Immunol Cell Biol. 2013. PMID: 23817579 Free PMC article.

References

    1. Janeway CA, Jr, Medzhitov R. Introduction: The role of innate immunity in the adaptive immune response. Seminars in Immunology. 1998;10:349–350. doi: 10.1006/smim.1998.0142. - DOI - PubMed
    1. Aderem A, Ulevitch RJ. Toll-like receptors in the induction of the innate immune response. Nature. 2000;406:782–787. doi: 10.1038/35021228. - DOI - PubMed
    1. Opal SM, Gluck T. Endotoxin as a drug target. Critical care medicine. 2003;31:S57–S64. doi: 10.1097/00003246-200301001-00009. - DOI - PubMed
    1. Arbour NC, Lorenz E, Schutte BC, Zabner J, Kline JN, Jones M, Frees KL, Watt JL, Schwartz DA. TLR4 mutations are associated with endotoxin hyporesponsiveness in humans. Nature Genetics. 2000;25:187–191. doi: 10.1038/76048. - DOI - PubMed
    1. Schwartz DA. The genetics of Innate Immunity. Chest. 2002;121:62S–68S. doi: 10.1378/chest.121.3_suppl.62S. - DOI - PubMed

Publication types

MeSH terms