. 2003 Jul 8;100(14):8424-9.
doi: 10.1073/pnas.1431692100. Epub 2003 Jun 25.

Understanding the function-structure and function-mutation relationships of p53 tumor suppressor protein by high-resolution missense mutation analysis

Affiliations

Understanding the function-structure and function-mutation relationships of p53 tumor suppressor protein by high-resolution missense mutation analysis

Shunsuke Kato et al. Proc Natl Acad Sci U S A. .

Abstract

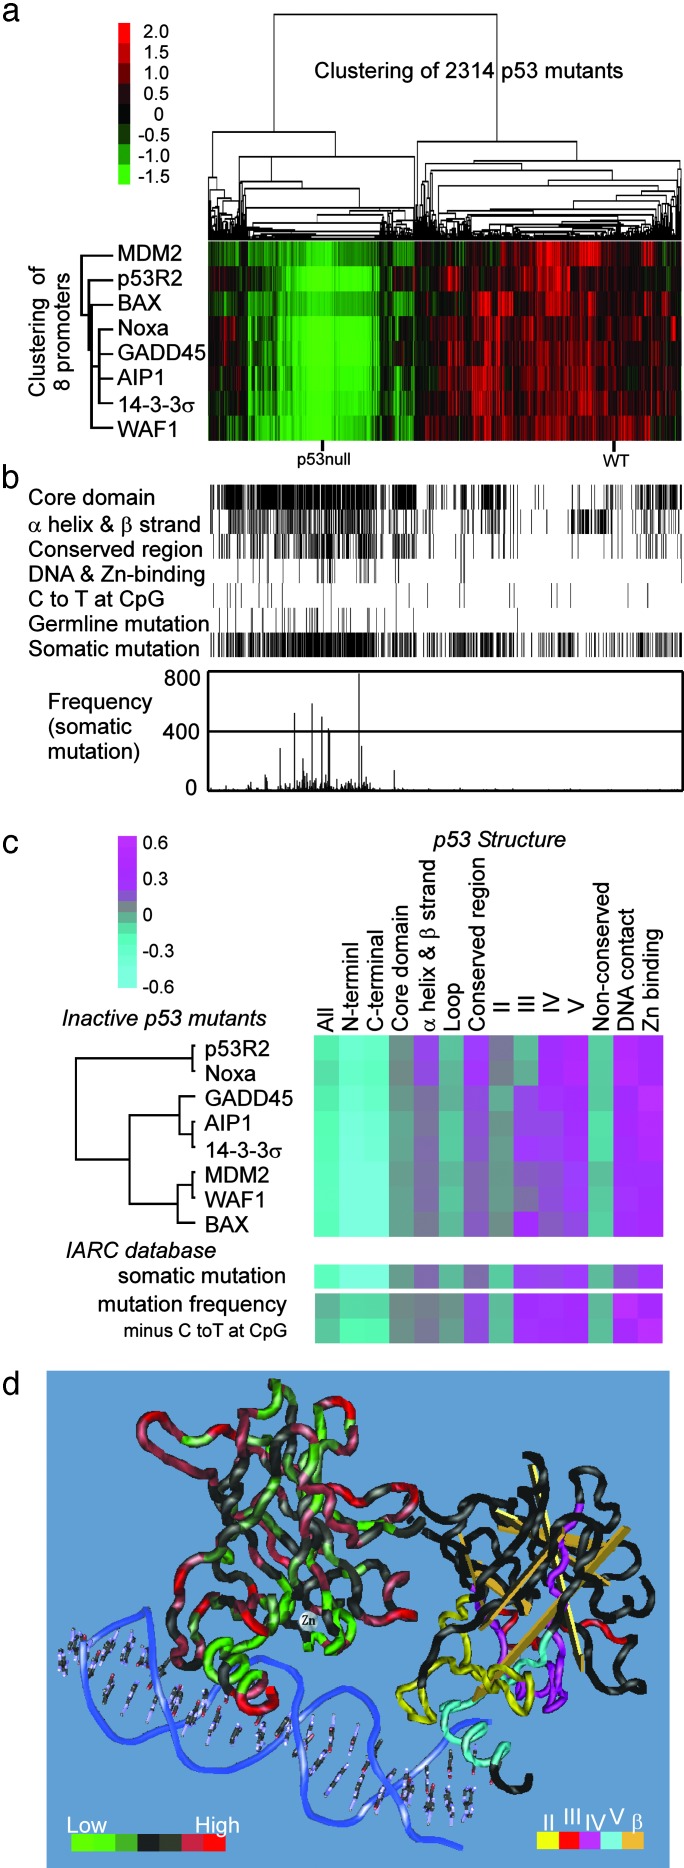
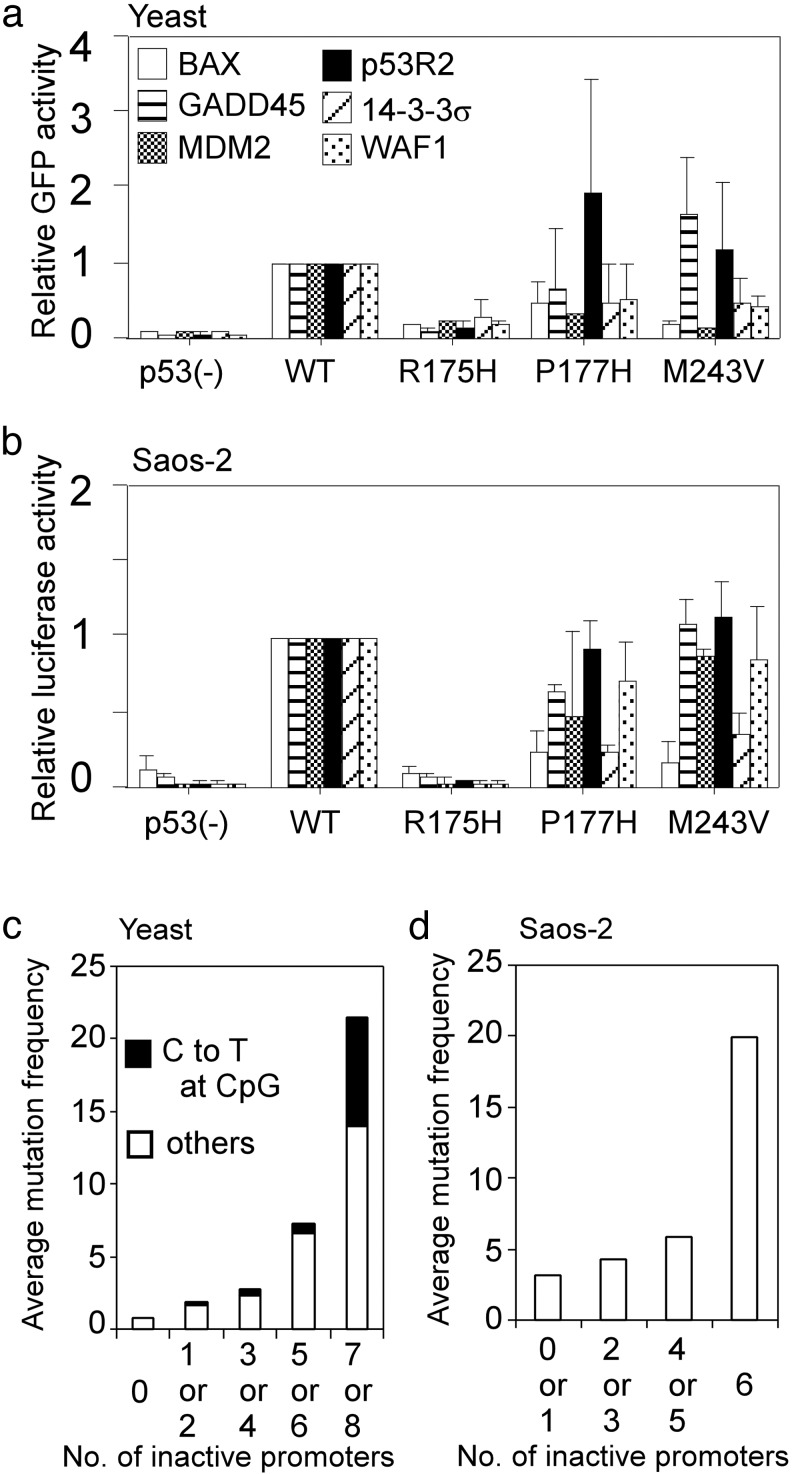
Inactivation of the tumor suppressor p53 by missense mutations is the most frequent genetic alteration in human cancers. The common missense mutations in the TP53 gene disrupt the ability of p53 to bind to DNA and consequently to transactivate downstream genes. However, it is still not fully understood how a large number of the remaining mutations affect p53 structure and function. Here, we used a comprehensive site-directed mutagenesis technique and a yeast-based functional assay to construct, express, and evaluate 2,314 p53 mutants representing all possible amino acid substitutions caused by a point mutation throughout the protein (5.9 substitutions per residue), and correlated p53 function with structure- and tumor-derived mutations. This high-resolution mutation analysis allows evaluation of previous predictions and hypotheses through interrelation of function, structure and mutation.


Figures

Fig. 1.
Fig. 1.
Construction of a p53 missense mutation library and a map of sequence-specific transactivities. (a) Schematic flow of construction of the mutant library. An example (P250A) of the 2,314 mutant p53 clones is shown. An oligonucleotide with a point mutation was used for PCR-based site-directed mutagenesis. The second PCR product was cotransformed with a linearized gap vector into a haploid yeast strain. The resulting yeast haploid cells (MATa) expressed a distinct p53 protein with an amino acid substitution corresponding to the original point mutation and also expressed EGFP, depending on the ability to transactivate through the p53BS of the human p21WAF1 promoter. The p53-expressing haploid cells were mated with other haploid cells (MATα) harboring a Ds-Red reporter plasmid with a p53BS other than the p21WAF1 promoter. (b) Schematic map of the p53 mutants showing transactivities for p21WAF1 promoter and mutation frequencies. (Bottom) The fluorescence intensities of the expressed EGFP (CLONTECH) for 2,314 clones were measured by a 96-well formatted fluorometer. Mean values derived from three independent experiments on the 2,314 clones were mapped from the NH2 terminus to the COOH terminus of the p53 protein. (Top) The frequency of each p53 missense mutation extracted from the IARC database (14) is indicated by the bar graph and 5 of the 10 most frequently reported mutations are labeled. (Middle) Primary structure of p53 showing the NH2-terminal portion (residues 1–95, purple) with the transactivation domain, the functionally defined DNA-binding domain (residues 96–286, yellow), and the COOH-terminal portion (residues 287–393, light blue) with the tetramerization domain. Residue numbers are italicized. Horizontal lines represent evolutionarily conserved regions I-V among vertebrates (29). The gray zone across the top and bottom indicates the functionally defined DNA-binding domain. (c) Fluorescence intensities of EGFP (p21WAF1) or Ds-Red (MDM2, BAX, 14–3-3σ, p53AIP1, GADD45, Noxa, and p53R2) were standardized and mapped from the NH2 terminus to the COOH terminus of the p53 protein. Relative fluorescence intensities are displayed from red (highest) to green (lowest). (d) The fluorescence intensities EGFP (p21WAF1) of the 2,314 clones were divided into 40 fractions and the frequency in each fraction is shown graphically. The NH2-terminal portion (purple), the sequence-specific DNA-binding domain (yellow), and the COOH-terminal portion (light blue) were also fractionated separately. The mean values of fluorescence intensities from wild-type p53 and p53 null clones are indicated as arrows.
Fig. 2.
Fig. 2.
Relationships among p53 function, structure, and mutation. (a) Unsupervised two-dimensional analysis of 2,314 p53 missense mutants plus p53 null and wild-type p53 controls. Fluorescence intensities of EGFP (p21WAF1) or Ds-Red (MDM2, BAX, 14-3-3σ, p53AIP1, GADD45, Noxa, and p53R2) were standardized and visualized by the cluster and treeview programs. Each column represents a p53 mutant and each row a p53 promoter. Relative fluorescence intensities are displayed from red (highest) to green (lowest). (b) Structural and IARC mutation information for the 2,314 mutants in a: residues in p53 core domains, four evolutionarily conserved regions in the core domain, secondary structure (α-helix and β-strand), DNA-contact, Zn-binding, germ-line mutation, and somatic mutation. Mutants caused by C-to-T transition at CpG sites are also noted. The frequency of somatic mutation for each mutant is shown graphically. (c) Comparison of relationship between p53 function and structure with relationship between p53 mutation and structure is shown. Susceptibility scores for p53 function, somatic mutation, and mutation frequency were calculated (see Materials and Methods and Table 5) and were visualized with the cluster and treeview programs. Relative susceptibility scores are displayed from pink (highest) to light blue (lowest). (d) Three-dimensional structure of the p53 core DNA-binding domain (National Center for Biotechnology Information 1TUP file) visualized by cn3d version 4.0 (19). The transactivities of the p53 mutants for the p21WAF1 promoter in each residue were averaged and were shown on the left (1TUP molecule B). The transactivities relative to wild-type activity are divided into seven fractions (<0.1, 0.1–0.15, 0.15–0.2, 0.2–0.25, 0.25–0.35, 0.35–0.6, and >0.6) and displayed from green (lowest) to red (highest). Structural information (highly conserved regions II-V and β-strands) was shown on the right (1TUP molecule C) using the indicated colors.
Fig. 3.
Fig. 3.
Schematic representation of the transactivity of p53 mutants within the tetramerization domain. (a) The transactivities of 204 p53 mutants within residues 323–356 were mapped on the primary structure. (bd) Residues affected by at least one type of amino acid substitution were mapped on the 3D structure (National Center for Biotechnology Information 3SAK file visualized by swiss-pdb viewer; ref. 20) of the tetramerization domain. The backbone structure (ribbon) is green (affected residues) or red (unaffected residues). (b) Right side view. The side chains of ten affected residues in theα-helix are shown. (c) Top view. The side chains of five affected residues in the β-strand are shown. (d) Front view. The side chains of three affected arginine residues are shown.
Fig. 4.
Fig. 4.
Comparison of p53 transactivation function in yeast with that in human cells. (a) Transactivities of three representative p53 mutants (R175H, P177H, and M243V) through the indicated six p53-binding sequences were shown as relative GFP (EGFP or Ds-Red) intensities against wild-type (WT) p53 activities. (b) The three mutants, which were the same as a were examined for their abilities to transactivate the luciferase reporter gene through the six corresponding promoters in Saos-2 cells. Bar, SD. (c) Average mutation frequency on number of inactivated promoters. Based on the yeast experiment, the 2,314 mutants were fractionated on the number of inactivated promoters for eight distinct p53-binding sequences. (d) Average mutation frequency on number of inactivated promoters based on the transactivities of 89 selected mutants in Saos-2 cells. Note that we did not choose mutants that theoretically occur by C-to-T transition at CpG sites as well as the top 10 hot spot mutants to avoid strong bias. In both c and d, mutation frequency for each mutant was derived from the IARC database and was averaged in each fraction.

References

    1. el-Deiry, W. S., Kern, S. E., Pietenpol, J. A., Kinzler, K. W. & Vogelstein, B. (1992) Nat. Genet. 1 45-49. - PubMed
    1. el-Deiry, W. S. (1998) Semin. Cancer Biol. 8 345-357. - PubMed
    1. Cho, Y., Gorina, S., Jeffrey, P. D. & Pavletich, N. P. (1994) Science 265 346-355. - PubMed
    1. Clore, G. M., Omichinski, J. G., Sakaguchi, K., Zambrano, N., Sakamoto, H., Appella, E. & Gronenborn, A. M. (1994) Science 265 386-391. - PubMed
    1. Jeffrey, P. D., Gorina, S. & Pavletich, N. P. (1995) Science 267 1498-1502. - PubMed

Publication types

MeSH terms