

Simulation of F-actin filaments of several microns
- PMID: 12829461
- PMCID: PMC1303062
- DOI: 10.1016/S0006-3495(03)74451-8
Simulation of F-actin filaments of several microns
Abstract
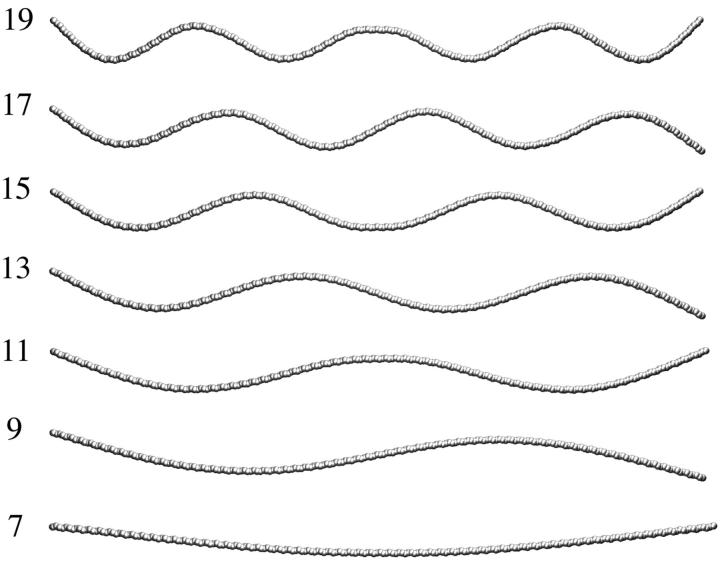
Here we report the results of applying substructure synthesis method to the simulation of F-actin filaments of several microns in length. The elastic deformational modes of long F-actin filaments were generated from the vibrational modes of the 13-subunit repeat of F-actin using a hierarchical synthesis scheme. The computationally synthesized deformational modes, in the very low-frequency regime, are in good agreement with theoretical solutions for long homogeneous elastic rods, which confirmed the usefulness of substructure synthesis method. Other low-frequency modes carry rich local deformational features that are unique to F-actins. All these modes thus provide a theoretical basis set for a description of spontaneously occurring thermal deformations, such as undulations, of the filaments. The results demonstrate that substructure synthesis method, as a method for computational modal analysis, is capable of scaling up the microscopic dynamic information, obtained from atomistic simulations, to a wide range of macroscopic length scale. Moreover, the combination of substructure synthesis method and hierarchical synthesis scheme provides an effective way in dealing with complex systems of periodic repeats that are abundant in cells.
Figures


Similar articles
-
Multiscale impact of nucleotides and cations on the conformational equilibrium, elasticity and rheology of actin filaments and crosslinked networks.Biomech Model Mechanobiol. 2015 Oct;14(5):1143-55. doi: 10.1007/s10237-015-0660-6. Epub 2015 Feb 24. Biomech Model Mechanobiol. 2015. PMID: 25708806
-
Stepwise sliding of single actin and Myosin filaments.Biophys J. 2004 Jan;86(1 Pt 1):353-8. doi: 10.1016/S0006-3495(04)74111-9. Biophys J. 2004. PMID: 14695277 Free PMC article.
-
Hyper-mobile water is induced around actin filaments.Biophys J. 2003 Nov;85(5):3154-61. doi: 10.1016/S0006-3495(03)74733-X. Biophys J. 2003. PMID: 14581215 Free PMC article.
-
Elasticity spectra as a tool to investigate actin cortex mechanics.J Nanobiotechnology. 2020 Oct 20;18(1):147. doi: 10.1186/s12951-020-00706-2. J Nanobiotechnology. 2020. PMID: 33081777 Free PMC article. Review.
-
Protein nanomachines.PLoS Biol. 2004 Mar;2(3):E73. doi: 10.1371/journal.pbio.0020073. Epub 2004 Mar 16. PLoS Biol. 2004. PMID: 15024422 Free PMC article. Review.
Cited by
-
The role of shape in determining molecular motions.Biophys J. 2005 Oct;89(4):2395-401. doi: 10.1529/biophysj.105.065904. Epub 2005 Jul 29. Biophys J. 2005. PMID: 16055547 Free PMC article.
-
fSUB: normal mode analysis with flexible substructures.J Phys Chem B. 2012 Jul 26;116(29):8636-45. doi: 10.1021/jp300312u. Epub 2012 Apr 5. J Phys Chem B. 2012. PMID: 22448847 Free PMC article.
-
PIM: phase integrated method for normal mode analysis of biomolecules in a crystalline environment.J Mol Biol. 2013 Mar 25;425(6):1082-98. doi: 10.1016/j.jmb.2012.12.026. Epub 2013 Jan 16. J Mol Biol. 2013. PMID: 23333742 Free PMC article.
-
Energetics and dynamics of constrained actin filament bundling.Biophys J. 2006 Jun 15;90(12):4295-304. doi: 10.1529/biophysj.105.076968. Epub 2006 Mar 24. Biophys J. 2006. PMID: 16565053 Free PMC article.
-
Response of an actin filament network model under cyclic stretching through a coarse grained Monte Carlo approach.J Theor Biol. 2011 Apr 7;274(1):109-19. doi: 10.1016/j.jtbi.2011.01.011. Epub 2011 Jan 15. J Theor Biol. 2011. PMID: 21241710 Free PMC article.
References
-
- Amadei, A., A. B. M. Linssen, and H. J. C. Berendsen. 1993. Essential dynamics of proteins. Proteins. 17:412–425. - PubMed
-
- Bahar, I., A. R. Atilgan, and B. Erman. 1997. Direct evaluation of thermal fluctuations in proteins using a single-parameter harmonic potential. Fold. Des. 2:173–181. - PubMed
-
- Brooks, B. R., D. Janezic, and M. Karplus. 1995. Harmonic analysis of large systems. I. Methodology. J. Comp. Chem. 16:1522–1542.
Publication types
MeSH terms
Substances
LinkOut - more resources
Full Text Sources
