Comparative Study
. 2003 Jul;85(1):49-60.
doi: 10.1016/S0006-3495(03)74453-1.

Comparison of calculation and experiment implicates significant electrostatic contributions to the binding stability of barnase and barstar

Affiliations
Comparative Study

Comparison of calculation and experiment implicates significant electrostatic contributions to the binding stability of barnase and barstar

Feng Dong et al. Biophys J. 2003 Jul.

Abstract

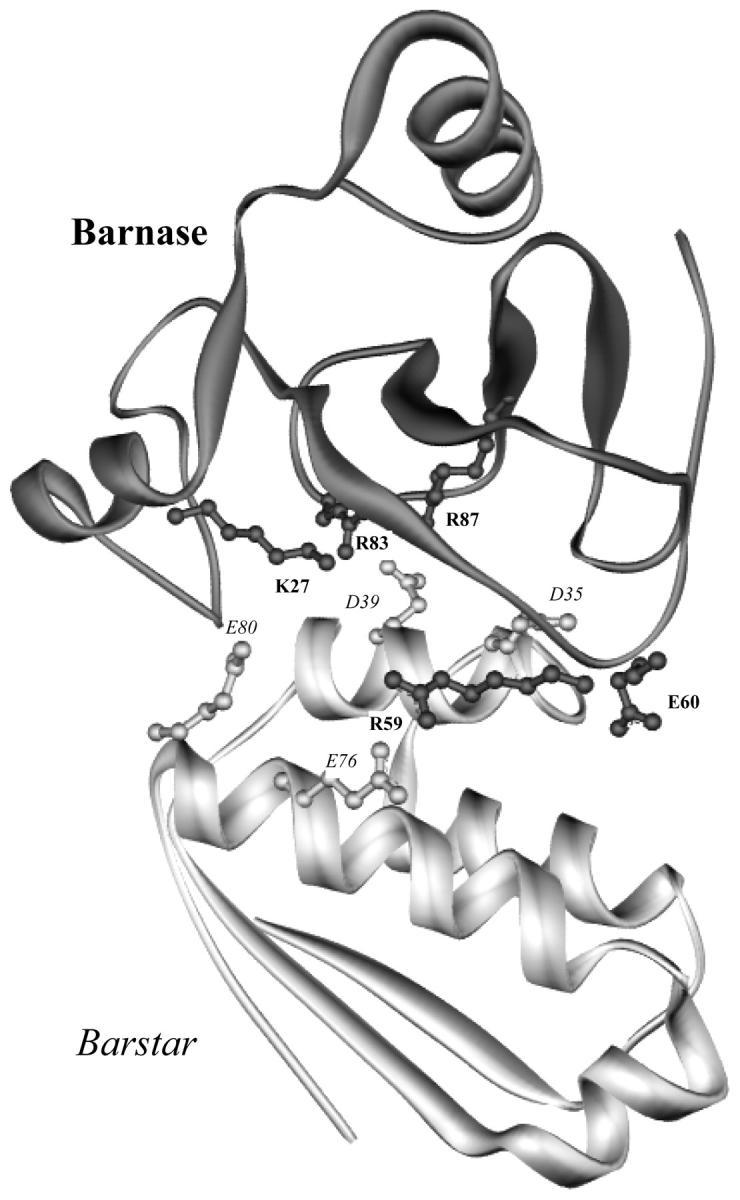
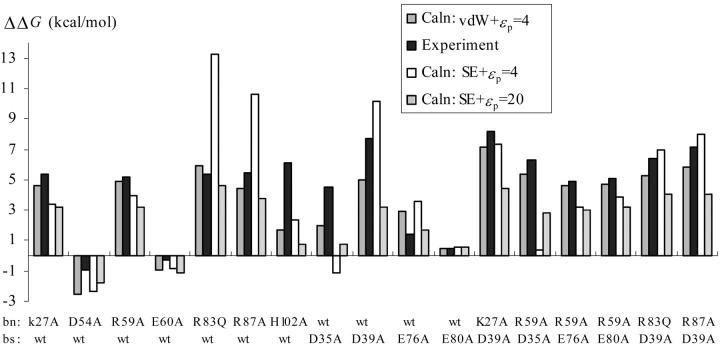
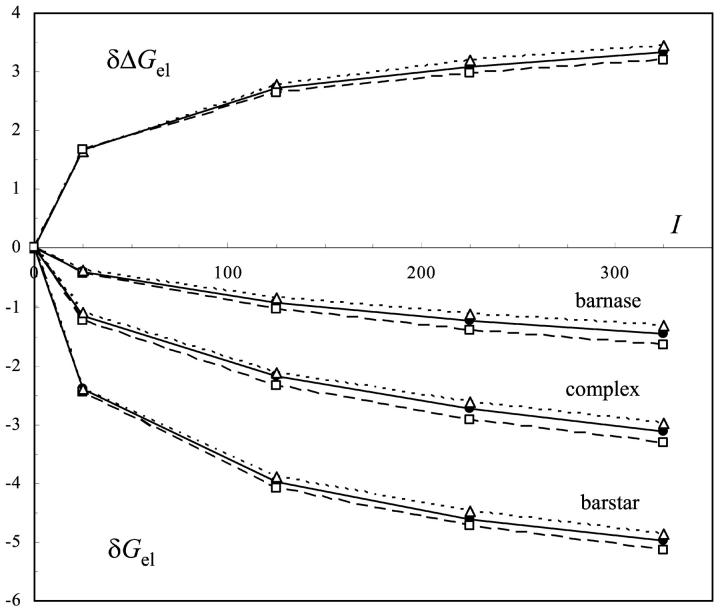
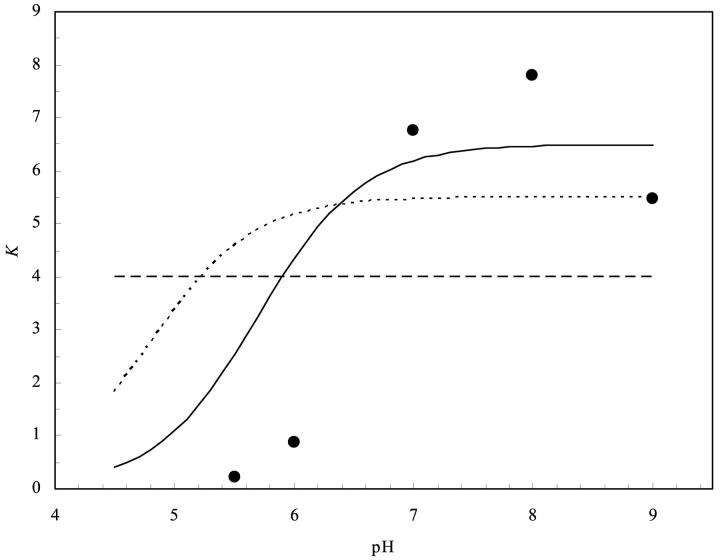
The contributions of electrostatic interactions to the binding stability of barnase and barstar were studied by the Poisson-Boltzmann model with three different protocols: a), the dielectric boundary specified as the van der Waals (vdW) surface of the protein along with a protein dielectric constant (epsilon (p)) of 4; b), the dielectric boundary specified as the molecular (i.e., solvent-exclusion (SE)) surface along with epsilon (p) = 4; and c), "SE + epsilon (p) = 20." The "vdW + epsilon (p) = 4" and "SE + epsilon (p) = 20" protocols predicted an overall electrostatic stabilization whereas the "SE + epsilon (p) = 4" protocol predicted an overall electrostatic destabilization. The "vdW + epsilon (p) = 4" protocol was most consistent with experiment. It quantitatively reproduced the observed effects of 17 mutations neutralizing charged residues lining the binding interface and the measured coupling energies of six charge pairs across the interface and reasonably rationalized the experimental ionic strength and pH dependences of the binding constant. In contrast, the "SE + epsilon (p) = 4" protocol predicted significantly larger coupling energies of charge pairs whereas the "SE + epsilon (p) = 20" protocol did not predict any pH dependence. This study calls for further scrutiny of the different Poisson-Boltzmann protocols and demonstrates potential danger in drawing conclusions on electrostatic contributions based on a particular calculation protocol.


Figures

FIGURE 1
FIGURE 1
The structure of the complex between barnase (top) and barstar (bottom). Charged residues lining the interface are shown. Barnase side chains are labeled in bold and barstar side chains are labeled in italic.
FIGURE 2
FIGURE 2
(A) One slice of the vdW surface of barnase. This slice also cut through seven channels leading to the exterior of the protein and one internal cavity. The cross sections of the channels are drawn in dotted lines; the cavity is labeled. (B) The dielectric map on the slice in A generated using the vdW surface as the dielectric boundary with a resolution of 0.5 Å per grid. (C) The dielectric map generated using the SE surface as the dielectric boundary. Protein interior grids with a dielectric constant of 4 are shown in black whereas solvent grids with a dielectric constant of 78 are in white. Dielectric smoothing (Madura et al., 1995) was employed, thus boundary grids had dielectric constant (ɛ) intermediate between 4 and 78. Three gray levels are used to represent grids with 4 < ɛ ≤ 10, 10 < ɛ ≤ 30 and 30 < ɛ < 78.
FIGURE 2
FIGURE 2
(A) One slice of the vdW surface of barnase. This slice also cut through seven channels leading to the exterior of the protein and one internal cavity. The cross sections of the channels are drawn in dotted lines; the cavity is labeled. (B) The dielectric map on the slice in A generated using the vdW surface as the dielectric boundary with a resolution of 0.5 Å per grid. (C) The dielectric map generated using the SE surface as the dielectric boundary. Protein interior grids with a dielectric constant of 4 are shown in black whereas solvent grids with a dielectric constant of 78 are in white. Dielectric smoothing (Madura et al., 1995) was employed, thus boundary grids had dielectric constant (ɛ) intermediate between 4 and 78. Three gray levels are used to represent grids with 4 < ɛ ≤ 10, 10 < ɛ ≤ 30 and 30 < ɛ < 78.
FIGURE 3
FIGURE 3
Comparison of calculated and measured effects of neutralizing charged residues lining the binding interface on the binding free energy.
FIGURE 4
FIGURE 4
Ionic strength of the electrostatic energy. Calculated results with the “vdW + ɛp = 4,” “SE + ɛp = 4,” and “SE + ɛp = 20” protocols are shown as filled diamonds connected by solid lines, open squares connected by dotted lines, and open triangles connected by dashed lines, respectively. δGel represents the difference in the electrostatic energy of a protein between a particular ionic strength and I = 0; δΔGel = ΔGel(I) − ΔGel(I = 0). The experimental ionic strength dependence is shown by filled circles.
FIGURE 5
FIGURE 5
pH Dependence of the binding constant (in units of 1012 M−1) at I = 110 mM. The filled circles are experimental data of Schreiber and Fersht (1993). The solid, dotted, and dashed curves are calculated according to Eq. 11 with the pKa values of bnH102 before and after complex formation set to the “vdW + ɛp = 4,” “SE + ɛp = 4,” and “SE + ɛp = 20” predictions, respectively (see Table 3).

References

    1. Albeck, S., R. Unger, and G. Schreiber. 2000. Evaluation of direct and cooperative contributions towards the strength of buried hydrogen bonds and salt bridges. J. Mol. Biol. 298:503–520. - PubMed
    1. Alexov, E. 2003. Role of the protein side-chain fluctuations on the strength of pair-wise electrostatic interactions: comparing experimental with computed pKas. Proteins. 50:94–103. - PubMed
    1. Antosiewicz, J., J. A. McCammon, and M. K. Gilson. 1994. Prediction of pH-dependent properties of proteins. J. Mol. Biol. 238:415–436. - PubMed
    1. Antosiewicz, J., J. A. McCammon, and M. K. Gilson. 1996. The determinants of pKas in proteins. Biochemistry. 35:7819–7833. - PubMed
    1. Buckle, A. M., and A. R. Fersht. 1994. Subsite binding in an RNase: structure of a barnase-tetranucleotide complex at 1.76-A resolution. Biochemistry. 33:1644–1653. - PubMed

LinkOut - more resources