Comparative Study
. 2003 Jul;85(1):61-9.
doi: 10.1016/S0006-3495(03)74454-3.

Posttransition state desolvation of the hydrophobic core of the src-SH3 protein domain

Affiliations
Comparative Study

Posttransition state desolvation of the hydrophobic core of the src-SH3 protein domain

Weihua Guo et al. Biophys J. 2003 Jul.

Abstract

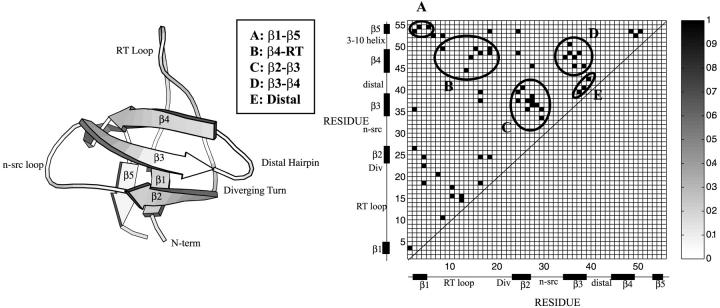
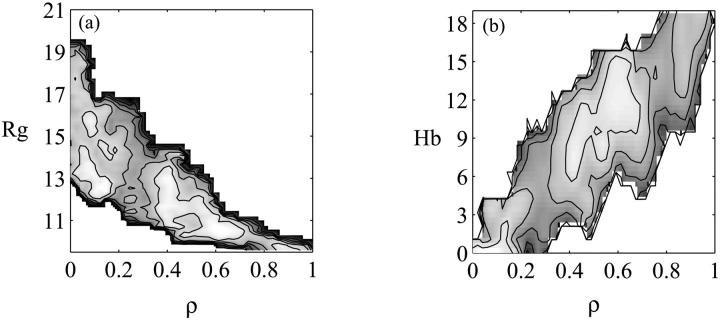
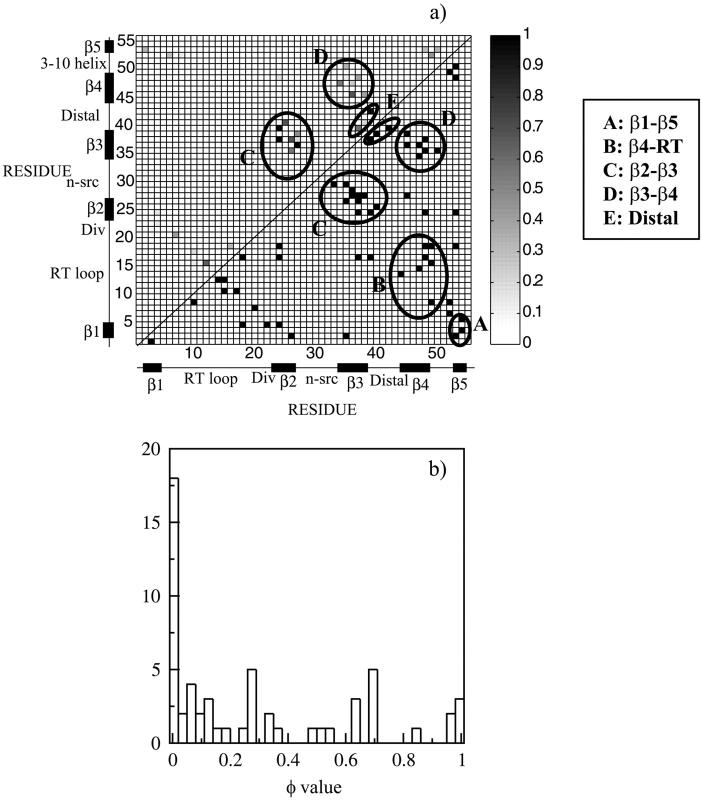
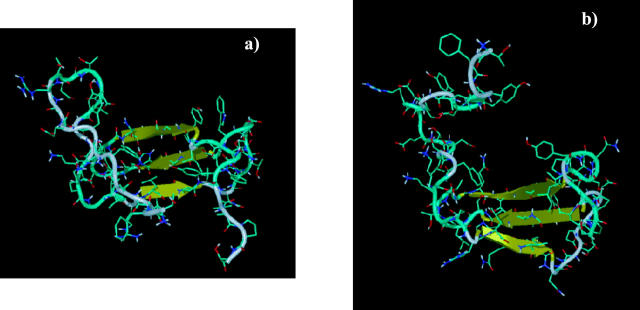
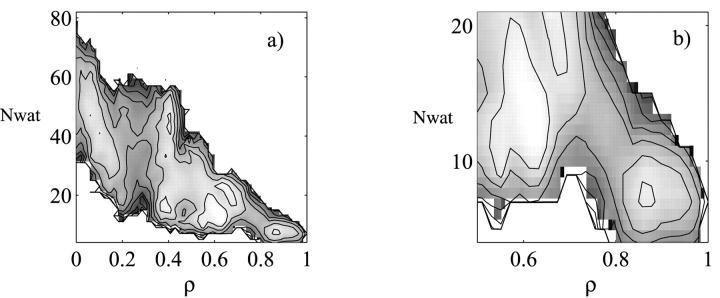
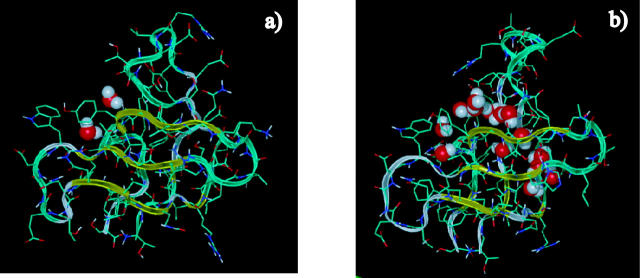
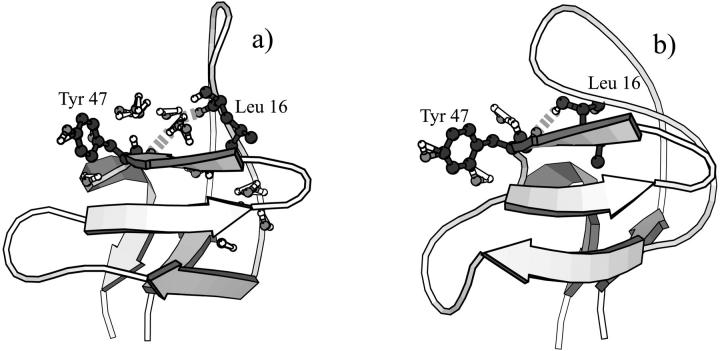
The folding thermodynamics of the src-SH3 protein domain were characterized under refolding conditions through biased fully atomic molecular dynamics simulations with explicit solvent. The calculated free energy surfaces along several reaction coordinates revealed two barriers. The first, larger barrier was identified as the transition state barrier for folding, associated with the formation of the first hydrophobic sheet of the protein. phi values calculated from structures residing at the transition state barrier agree well with experimental phi values. The microscopic information obtained from our simulations allowed us to unambiguously assign intermediate phi values as the result of multiple folding pathways. The second, smaller barrier occurs later in the folding process and is associated with the cooperative expulsion of water molecules between the hydrophobic sheets of the protein. This posttransition state desolvation barrier cannot be observed through traditional folding experiments, but is found to be critical to the correct packing of the hydrophobic core in the final stages of folding. Hydrogen exchange and NMR experiments are suggested to probe this barrier.


Figures

FIGURE 1
FIGURE 1
Cartoon diagram of the src-SH3 protein domain and native contact map. A native contact is defined between two residues if the center of geometry of the side chains is <6.5 Å apart. A total of 57 native contacts, listed in Table 1, are obtained in this manner.
FIGURE 2
FIGURE 2
(a) Free energy surface at T = 343 K as a function of the fraction of native contacts ρ and the radius of gyration Rg. (b) Free energy surface at T = 343 K as a function of the fraction of native contacts ρ and the number of hydrogen bonds Hb. Contour lines are drawn every 1 kcal/mol.
FIGURE 3
FIGURE 3
(a) Contact map of the φ values obtained from the structures residing at the free energy barrier of ρ = 0.3 (left hand quadrant). The φ values were calculated according to Eq. 2. Structure is present in the first hydrophobic sheet of the protein consisting of the central β2-β3-β4 strands whereas the rest of the protein is mostly unstructured. The native contact map is shown in the right hand quadrant. (b) Histogram of the φ values. The histogram shows populations at high and low φ values, emphasizing the polarized nature of the transition state.
FIGURE 4
FIGURE 4
Two typical transition state structures are represented in a and b. Structure is present in both cases in the central β2-β3-β4 region. The rest of the protein is mostly unstructured, the degree of structure varying from one transition state conformation to another.
FIGURE 5
FIGURE 5
(a) Free energy surface at T = 343 K as a function of the fraction of native contacts ρ and the number of core water molecules. The core of the protein is defined by an 8-Å radius centered around the hydrophobic core of the protein. The waters residing inside the core are considered core water molecules. (b) Blow up of the free energy in the vicinity of the desolvation barrier. Contour lines are drawn every 1 kBT.
FIGURE 6
FIGURE 6
Structures after (a) and before (b) the desolvation barrier. The hydrophobic core is complete after the desolvation barrier, with no waters in the immediate core. Right before the barrier, the two hydrophobic sheets of the protein are fully formed, but are not packed. Water molecules reside in the core.
FIGURE 7
FIGURE 7
Water molecules before the barrier serve as hydrogen bond bridges between the two core sheets. In Fig. 7 a, a water molecule bridges Leu-16 (RT loop) and Tyr-47 (β4). In Fig. 7 b, postdesolvation, Leu-16 and Tyr-47 form a direct hydrogen bond, closing the hydrophobic core through the RT loop-β4 interaction.

References

    1. Borreguero, J. M., N. V. Dokholyan, S. V. Buldyrev, E. I. Shakhnovich, and H. E. Stanley. 2002. Thermodynamics and folding kinetics analysis of the SH3 domain form discrete molecular dynamics. J. Mol. Biol. 318:863–876. - PubMed
    1. Brooks, B. R., R. E. Bruccoleri, B. D. Olafson, D. J. States, D. J. Swaminathan, and M. Karplus. 1982. CHARMM: a program for macromolecular energy, minimization, and dynamics calculations. J. Comput. Chem. 4:187–217.
    1. Bryngelson, J. D., J. N. Onuchic, and P. G. Wolynes. 1995. Funnels, pathways and the energy landscape of protein folding: a synthesis. Proteins. 21:167–195. - PubMed
    1. Bryngelson, J. D., and P. G. Wolynes. 1987. Spin glasses and the statistical mechanics of protein folding. Proc. Natl. Acad. Sci. USA. 84:7524–7528. - PMC - PubMed
    1. Bryngelson, J. D., and P. G. Wolynes. 1990. A simple statistical field theory of heteropolymer collapse with application to protein folding. Biopolymers. 30:177–188.

Publication types

LinkOut - more resources