

Kinetic effects of fiber type on the two subcomponents of the Huxley-Simmons phase 2 in muscle
- PMID: 12829493
- PMCID: PMC1303094
- DOI: 10.1016/S0006-3495(03)74483-X
Kinetic effects of fiber type on the two subcomponents of the Huxley-Simmons phase 2 in muscle
Abstract
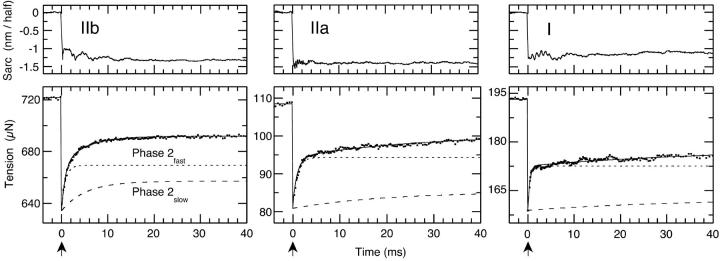
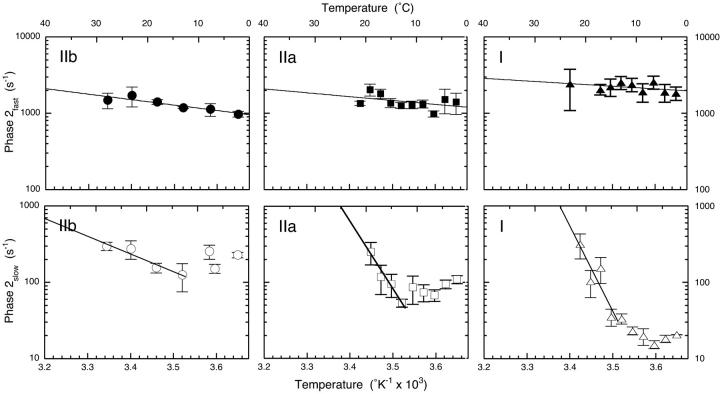
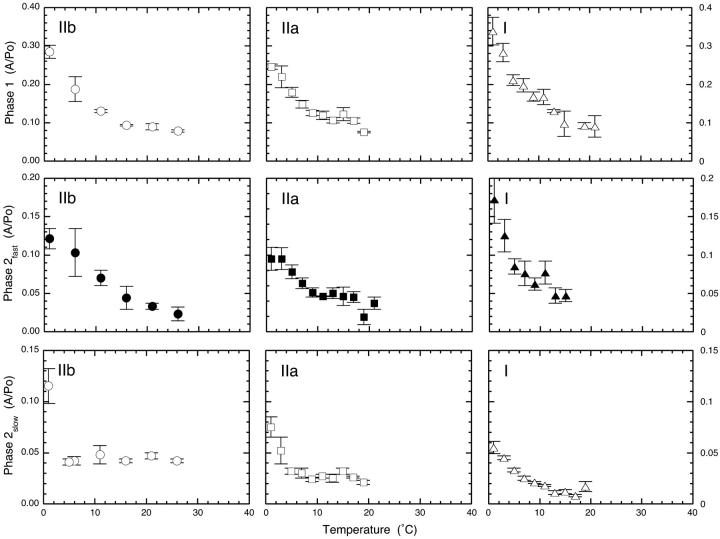
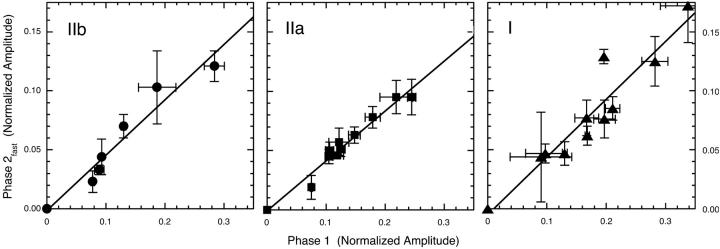
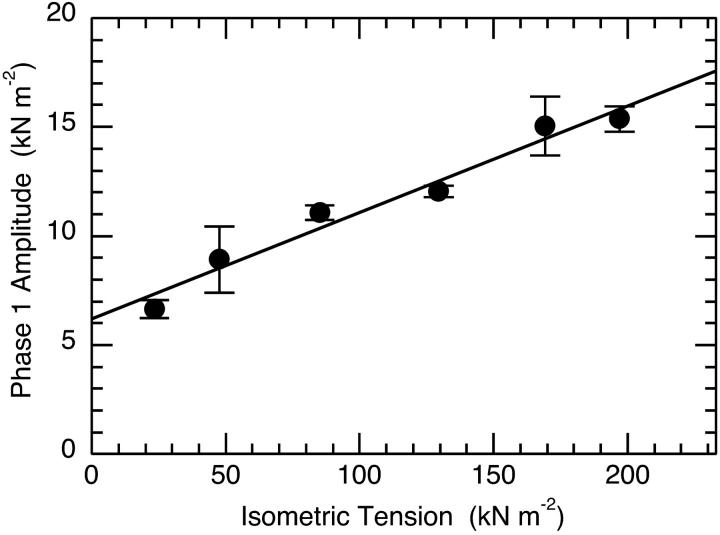
The Huxley-Simmons phase 2 controls the kinetics of the first stages of tension recovery after a step-change in fiber length and is considered intimately associated with tension generation. It had been shown that phase 2 is comprised of two distinct unrelated phases. This is confirmed here by showing that the properties of phase 2(fast) are independent of fiber type, whereas those of phase 2(slow) are fiber type dependent. Phase 2(fast) has a rate of 1000-2000 s(-1) and is temperature insensitive (Q(10) approximately 1.16) in fast, medium, and slow speed fibers. Regardless of fiber type and temperature, the amplitude of phase 2(fast) is half (approximately 0.46) that of phase 1 (fiber instantaneous stiffness). Consequently, fiber compliance (cross-bridge and thick/thin filament) appears to be the common source of both phase 1 elasticity and phase 2(fast) viscoelasticity. In fast fibers, stiffness increases in direct proportion to tension from an extrapolated positive origin at zero tension. The simplest explanation is that tension generation can be approximated by two-state transition from attached preforce generating (moderate stiffness) to attached force generating (high stiffness) states. Phase 2(slow) is quite different, progressively slowing in concert with fiber type. An interesting interpretation of the amplitude and rate data is that reverse coupling of phase 2(slow) back to P(i) release and ATP hydrolysis appears absent in fast fibers, detectable in medium speed fibers, and marked in slow fibers contracting isometrically. Contracting slow and heart muscles stretched under load could employ this enhanced reversibility of the cross-bridge cycle as a mechanism to conserve energy.
Figures
Similar articles
-
Tension relaxation after stretch in resting mammalian muscle fibers: stretch activation at physiological temperatures.Biophys J. 1996 Mar;70(3):1432-8. doi: 10.1016/S0006-3495(96)79702-3. Biophys J. 1996. PMID: 8785299 Free PMC article.
-
A single order-disorder transition generates tension during the Huxley-Simmons phase 2 in muscle.Biophys J. 1993 Nov;65(5):1886-98. doi: 10.1016/S0006-3495(93)81259-1. Biophys J. 1993. PMID: 8298018 Free PMC article.
-
Endothermic force generation in fast and slow mammalian (rabbit) muscle fibers.Biophys J. 1996 Oct;71(4):1905-13. doi: 10.1016/S0006-3495(96)79389-X. Biophys J. 1996. PMID: 8889165 Free PMC article.
-
Muscle mechanics: adaptations with exercise-training.Exerc Sport Sci Rev. 1996;24:427-73. Exerc Sport Sci Rev. 1996. PMID: 8744258 Review.
-
Kinetic and physical characterization of force generation in muscle: a laser temperature-jump and length-jump study on activated and contracting rigor fibers.Adv Exp Med Biol. 1993;332:513-24; discussion 525-6. doi: 10.1007/978-1-4615-2872-2_47. Adv Exp Med Biol. 1993. PMID: 8109364 Review.
Cited by
-
Mechanism of tension generation in muscle: an analysis of the forward and reverse rate constants.Biophys J. 2007 Apr 15;92(8):2865-74. doi: 10.1529/biophysj.106.101477. Epub 2007 Jan 26. Biophys J. 2007. PMID: 17259275 Free PMC article.
-
Role of myosin heavy chain composition in the stretch activation response of rat myocardium.J Physiol. 2007 Feb 15;579(Pt 1):161-73. doi: 10.1113/jphysiol.2006.119719. Epub 2006 Nov 30. J Physiol. 2007. PMID: 17138609 Free PMC article.
-
The Mechanism of Modulation of Cardiac Force by Temperature.Int J Mol Sci. 2025 Jan 8;26(2):469. doi: 10.3390/ijms26020469. Int J Mol Sci. 2025. PMID: 39859186 Free PMC article.
-
Measuring myosin cross-bridge attachment time in activated muscle fibers using stochastic vs. sinusoidal length perturbation analysis.J Appl Physiol (1985). 2011 Apr;110(4):1101-8. doi: 10.1152/japplphysiol.00800.2010. Epub 2011 Jan 13. J Appl Physiol (1985). 2011. PMID: 21233339 Free PMC article.
-
Differential effects of myosin activators on myocardial contractile function in nonfailing and failing human hearts.Am J Physiol Heart Circ Physiol. 2025 Jan 1;328(1):H161-H173. doi: 10.1152/ajpheart.00252.2024. Epub 2024 Oct 25. Am J Physiol Heart Circ Physiol. 2025. PMID: 39453428 Free PMC article.
References
-
- Bagni, M. A., G. Cecchi, E. Cecchini, B. Colombini, and F. Colomo. 1998. Force responses to fast ramp stretches in stimulated frog skeletal muscle fibres. J. Muscle Res. Cell Motil. 19:33–42. - PubMed
-
- Bershitsky, S. Y., A. K. Tsaturyan, O. N. Bershitskaya, G. I. Mashanov, P. Brown, R. Burns, and M. A. Ferenczi. 1997. Muscle force is generated by myosin heads stereospecifically attached to actin. Nature. 388:186–190. - PubMed
Publication types
MeSH terms
LinkOut - more resources
Full Text Sources
Research Materials
Miscellaneous
