. 2003 Jul;85(1):537-48.
doi: 10.1016/S0006-3495(03)74498-1.

Concentration effect on the aggregation of a self-assembling oligopeptide

Affiliations

Concentration effect on the aggregation of a self-assembling oligopeptide

S Y Fung et al. Biophys J. 2003 Jul.

Abstract

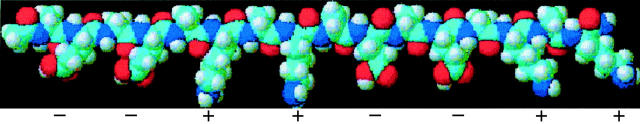
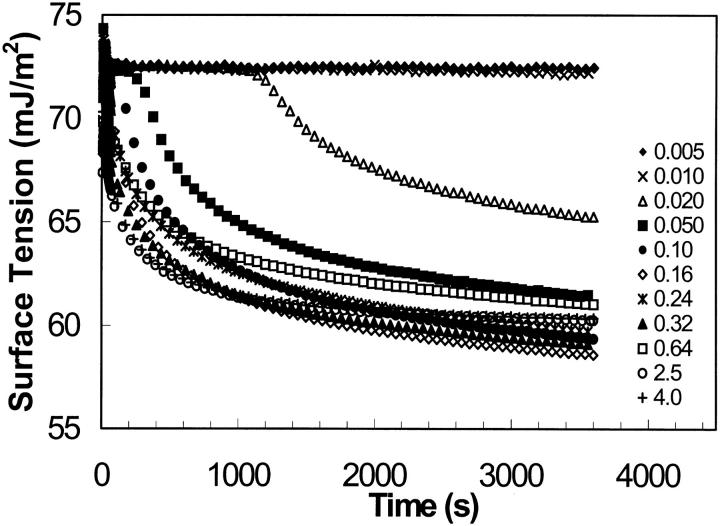
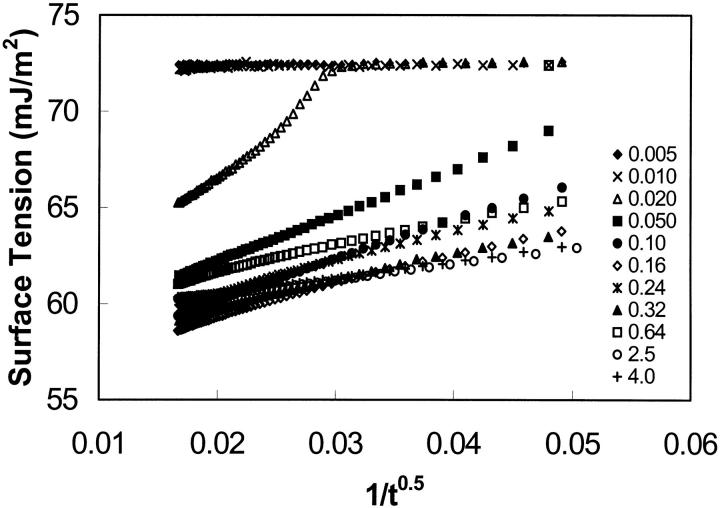
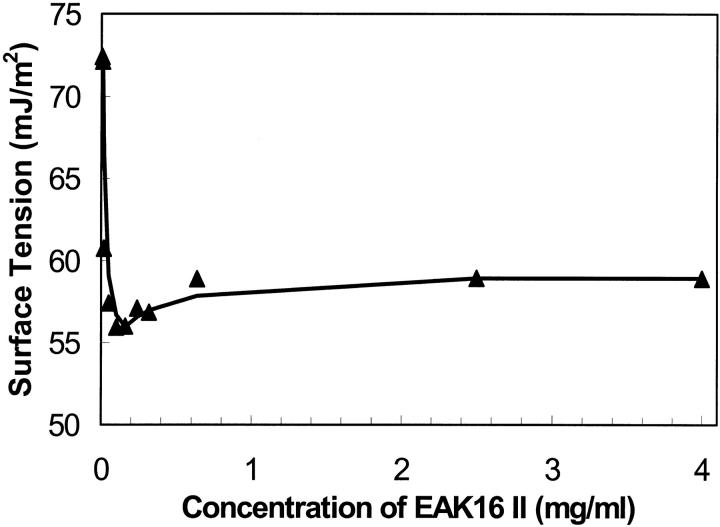
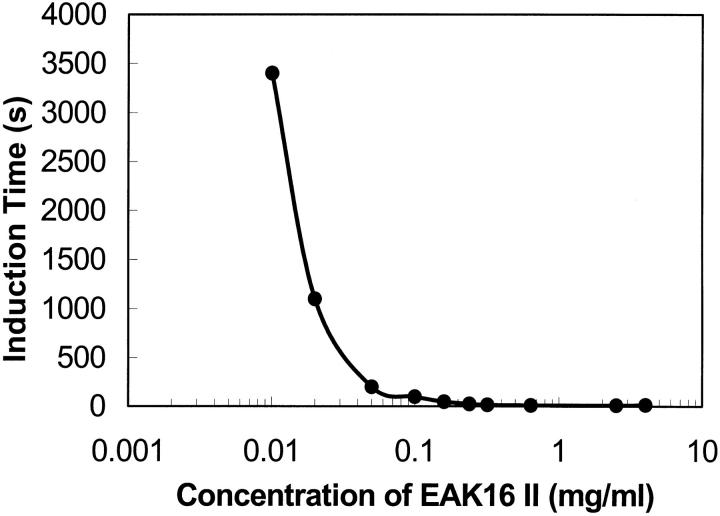
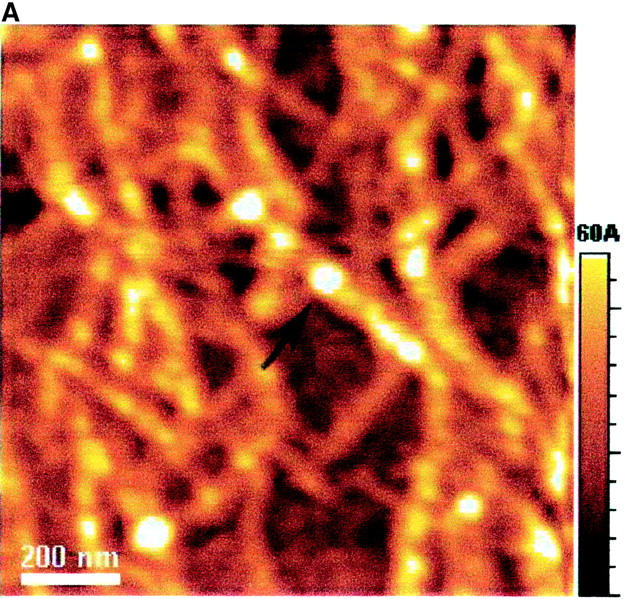
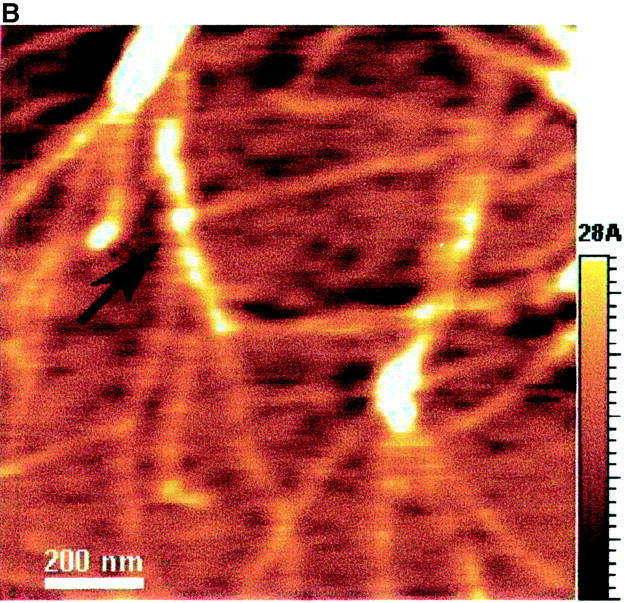
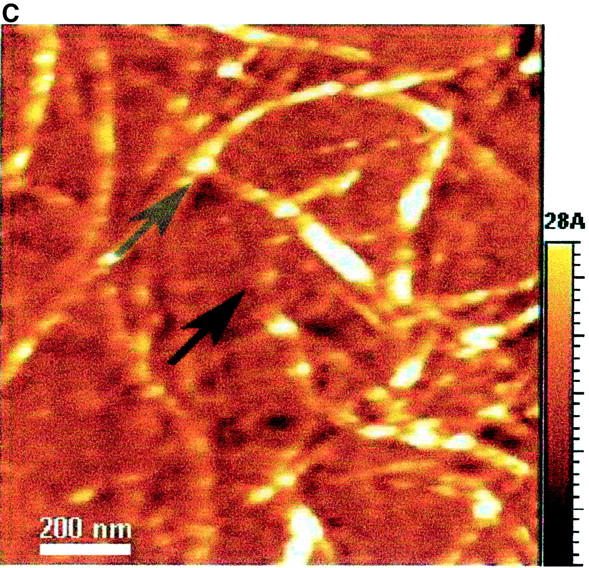
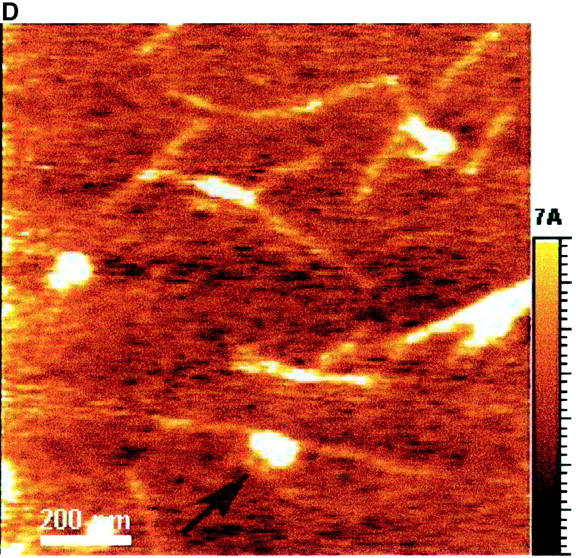
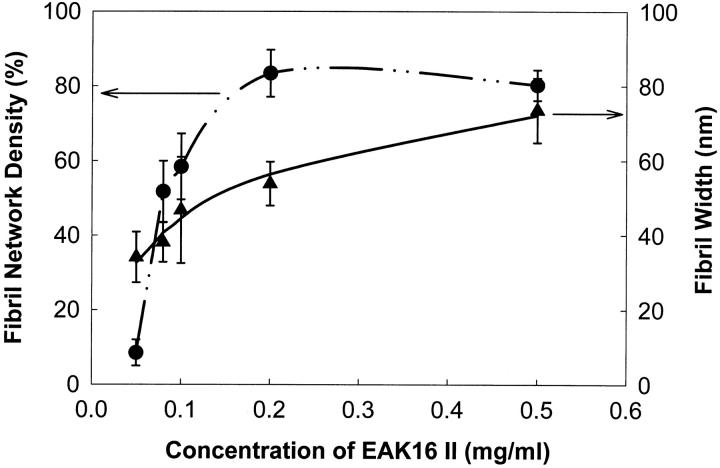
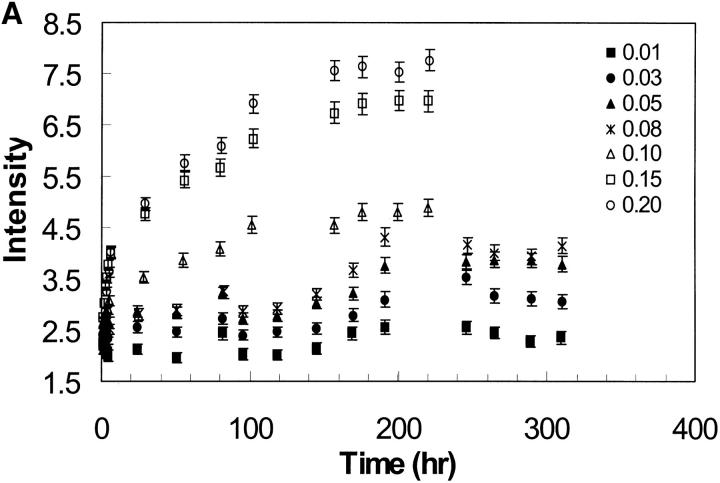
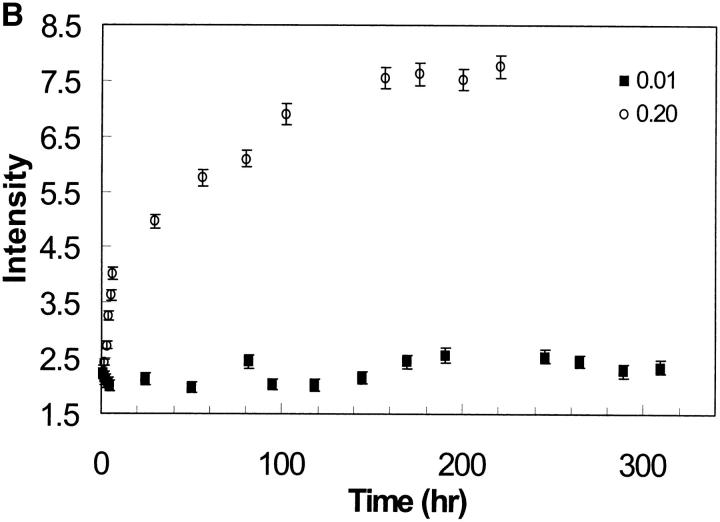
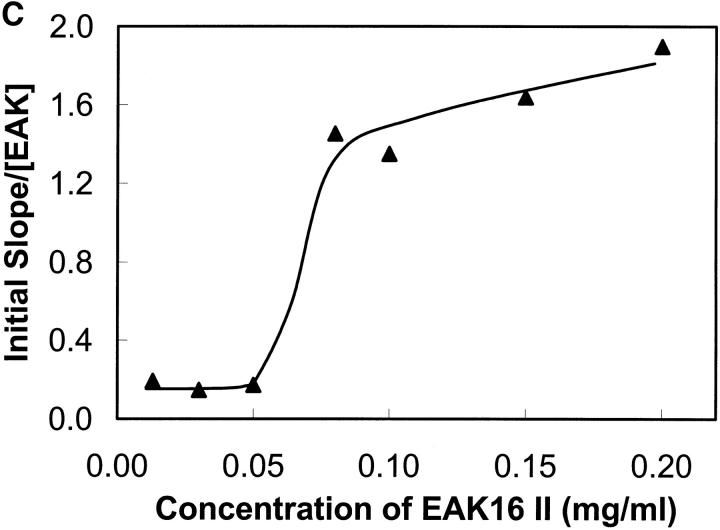
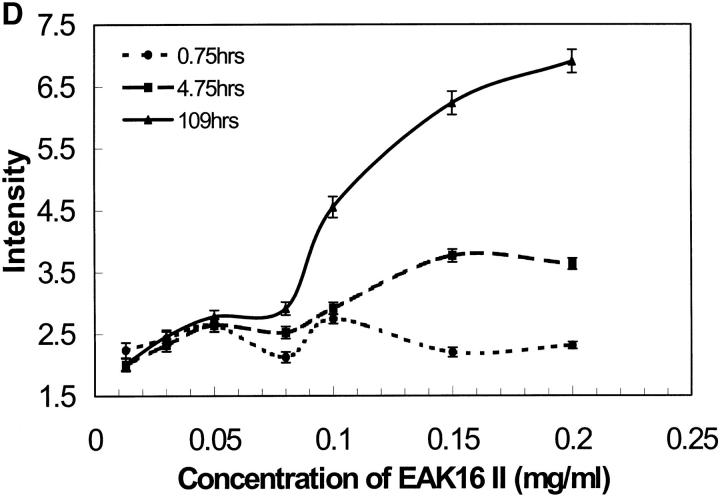
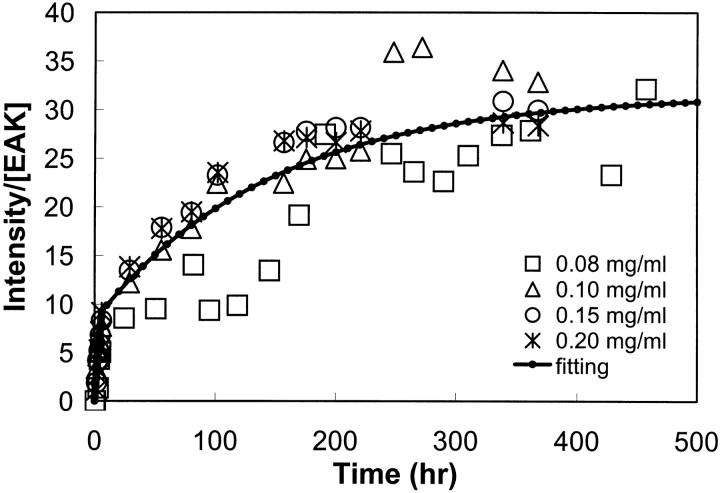
Concentration is a key parameter in controlling the aggregation of self-assembling oligopeptides. By investigating the concentration effects, an aggregation mechanism of EAK16-II is proposed. Depending on the critical aggregation concentration (CAC) of EAK16-II, the oligopeptide aggregates into protofibrils through seeding and/or a nucleation process. Protofibrils then associate with each other to form fibrils. The CAC was found to be approximately 0.1 mg/ml by surface tension measurements. The nanostructures of aggregates were imaged and analyzed by atomic force microscopy. Globular and fibrillar aggregates were observed, and their dimensions were further quantified. To ensure that the aggregates were formed in bulk solution, light scattering (LS) measurements were conducted to monitor the fibril formation with time. The LS profile showed two different rates of aggregation depending on whether the peptide concentration was above or below the CAC. At high concentrations, the LS intensity increased strongly at early times. At low concentrations, the LS intensity increased only slightly. Our study provides information about the nature of the oligopeptide self-assembly, which is important to the understanding of the fibrillogenesis occurring in conformational diseases and to many biomedical engineering applications.


Figures

FIGURE 1
FIGURE 1
3D optimized molecular structure of EAK16-II. The amino acid sequence is AEAEAKAKAEAEAKAK. Two alternating positive (+) and negative (−) charges correspond to the glutamic acid (E) and lysine (K) residues, respectively. The upper side is hydrophobic because of the alanine (A) residues; the lower side is hydrophilic due to the glutamic acid and lysine residues. The length of the backbone is around 6.5 nm while the width ranges from 0.3 to 0.7 nm (3D optimized image from ACD/3D freeware, Toronto, ON, Canada).
FIGURE 2
FIGURE 2
A schematic diagram for derivation of the equation to correct the fibril width. The wide dotted line represents the directly observed image profile from AFM with a width of W. W* is the actual width of the fibril. The actual fibril width can be derived as W* = W − 2X, where formula image H and Rc are the fibril height and the radius of curvature of the AFM probe tip, respectively. For EAK16-II fibrils and silicone crystal tips (Rc = 10 nm) used in the work, the actual width, W*, is 15%–30% less than the observed width, W.
FIGURE 3
FIGURE 3
Dynamic surface tension of EAK16-II solutions. The concentrations are ranging from 0.005 to 4.0 mg/ml. The errors of all data points are within a standard deviation of ±0.3 mJ/m2.
FIGURE 4
FIGURE 4
Surface tension versus 1/t0.5 for different concentrations of EAK16-II (0.005–4.0 mg/ml); 1/t0.5 ≤ 0.05s−0.5. The errors of all data points are within a standard deviation of ±0.3 mJ/m2. The equilibrium surface tension was estimated by a linear extrapolation to the y axis.
FIGURE 5
FIGURE 5
Relationship between the equilibrium surface tension and concentration of EAK16-II in water solutions. When the concentration increases, the surface tension drops dramatically down to a minimum value, then it increases slightly back to a plateau. The critical aggregation concentration is found to be around 0.1 mg/ml. All data errors are within the range of ±0.18 mJ/m2.
FIGURE 6
FIGURE 6
Induction time with selected concentrations of EAK16-II. The induction time is observed as a period before the surface tension starts to drop in dynamic surface tension measurements. It exists in most biomolecular systems. The induction time is close to zero after the concentration of 0.05 mg/ml. The data errors range from ±1.5 to ±100 s.
FIGURE 7
FIGURE 7
AFM images of EAK16-II on mica with different concentrations: (A) 0.5 mg/ml; (B) 0.2 mg/ml; (C) 0.1 mg/ml; (D) 0.05 mg/ml. The size and the density of fibrils reduce as the concentration decreases. The fibril width of each concentration is 73.5 ± 8.67, 53.9 ± 5.87, 46.8 ± 14.2, and 34.1 ± 6.81 nm in A, B, C, and D, respectively. Two types of nanostructures, globular aggregates and filaments, are found at the concentration of 0.05 mg/ml. They are considered as protofibrils which can further aggregate into fibrils. Arrows indicate the globular aggregates within the fibrils or isolated on the surface. The AFM images support our proposed aggregation model of EAK16-II.
FIGURE 7
FIGURE 7
AFM images of EAK16-II on mica with different concentrations: (A) 0.5 mg/ml; (B) 0.2 mg/ml; (C) 0.1 mg/ml; (D) 0.05 mg/ml. The size and the density of fibrils reduce as the concentration decreases. The fibril width of each concentration is 73.5 ± 8.67, 53.9 ± 5.87, 46.8 ± 14.2, and 34.1 ± 6.81 nm in A, B, C, and D, respectively. Two types of nanostructures, globular aggregates and filaments, are found at the concentration of 0.05 mg/ml. They are considered as protofibrils which can further aggregate into fibrils. Arrows indicate the globular aggregates within the fibrils or isolated on the surface. The AFM images support our proposed aggregation model of EAK16-II.
FIGURE 8
FIGURE 8
The density of fibril networks of EAK16-II on mica and the width of EAK16-II fibrils versus concentrations. The value of fibril density increases sharply around 0.1 mg/ml (CAC), but the fibril width increases moderately with concentrations. The large error range of fibril width at 0.1 mg/ml concentration may imply a nucleation process upon the CAC.
FIGURE 9
FIGURE 9
(A) Light scattering of EAK16-II solutions with time in different concentrations from 0.013 to 0.2 mg/ml. The data are separated into two groups according to EAK16-II concentration. In the high concentration group (0.08–0.2 mg/ml), the LS intensity increases dramatically with time within the first 10 h. In the low concentration group (0.013–0.05 mg/ml), the LS intensity does not change much with time. (B) The initial difference of LS intensity upon whether the concentration is above and below the CAC. Above the CAC (full circle), the LS intensity increases fast within the first 6 h. Below the CAC (star), the LS intensity does not change with time. (C) The rate of LS intensity change over the first 6 h (initial slope obtained from Fig. 9 A) as a function of concentration. [EAK] represents the concentration of EAK16-II. The value jumps dramatically from 0.17 to 1.45 around the CAC, which shows two distinguishable groups of data. (D) The intensity of light scattering plotted with concentrations at different timescales (• 0.75 h; ▪ 4.75 h; ▴ 109 h). The LS intensity increases after 5 h when the concentration is above 0.08 mg/ml, which is close to the CAC.
FIGURE 9
FIGURE 9
(A) Light scattering of EAK16-II solutions with time in different concentrations from 0.013 to 0.2 mg/ml. The data are separated into two groups according to EAK16-II concentration. In the high concentration group (0.08–0.2 mg/ml), the LS intensity increases dramatically with time within the first 10 h. In the low concentration group (0.013–0.05 mg/ml), the LS intensity does not change much with time. (B) The initial difference of LS intensity upon whether the concentration is above and below the CAC. Above the CAC (full circle), the LS intensity increases fast within the first 6 h. Below the CAC (star), the LS intensity does not change with time. (C) The rate of LS intensity change over the first 6 h (initial slope obtained from Fig. 9 A) as a function of concentration. [EAK] represents the concentration of EAK16-II. The value jumps dramatically from 0.17 to 1.45 around the CAC, which shows two distinguishable groups of data. (D) The intensity of light scattering plotted with concentrations at different timescales (• 0.75 h; ▪ 4.75 h; ▴ 109 h). The LS intensity increases after 5 h when the concentration is above 0.08 mg/ml, which is close to the CAC.
FIGURE 10
FIGURE 10
Light scattering corrected by bulk EAK16-II concentration versus time. EAK16-II concentrations range from 0.08 to 0.2 mg/ml. The data were fitted to a bimodal kinetic model of aggregation of EAK16-II (solid line). The data was normalized by EAK16-II concentration ([EAK]).

Similar articles

Cited by

References

    1. Adamson, A. W., and A. P. Gast. 1997. Physical Chemistry of Surfaces, 6th ed. John Wiley & Sons, New York.
    1. Altman, M., P. Lee, A. Rich, and S. Zhang. 2000. Conformational behavior of ionic self-complementary peptides. Protein Sci. 9:1095–1105. - PMC - PubMed
    1. Cabrerizo-Vilchez, M. A., Z. Policova, D. Y. Kwok, P. Chen, and A. W. Neumann. 1995. The temperature dependence of the interfacial tension of aqueous human albumin solution/decane. Colloids Surf. B Biointerfaces. 5:1–9.
    1. Campbell, N. A. 1993. Biology, 3rd ed. Benjamin/Cummings Publishing Company, Inc., Redwood City.
    1. Chen, P., S. Lahooti, Z. Policova, M. A. Cabrerizo-Vilchez, and A. W. Neumann. 1996. Concentration dependence of the film pressure of human serum albumin at the water/decane interface. Colloids Surf. B Biointerfaces. 6:279–289.

Publication types

LinkOut - more resources