. 2003 Jul;85(1):549-58.
doi: 10.1016/S0006-3495(03)74499-3.

Redox-induced structural dynamics of Fe-heme ligand in myoglobin by X-ray absorption spectroscopy

Affiliations

Redox-induced structural dynamics of Fe-heme ligand in myoglobin by X-ray absorption spectroscopy

S Della Longa et al. Biophys J. 2003 Jul.

Abstract

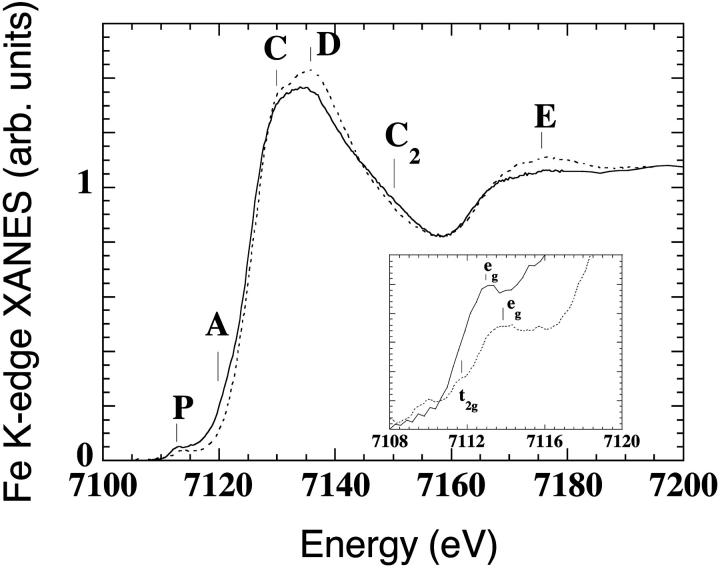
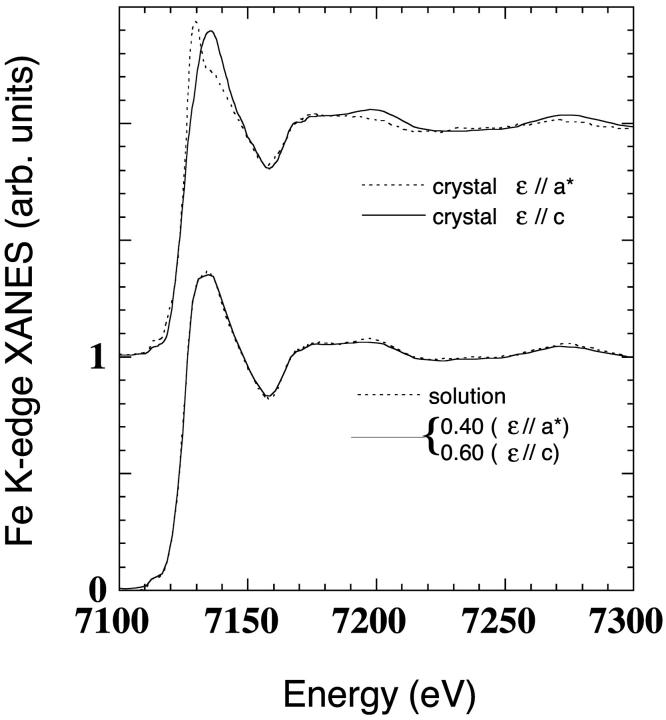
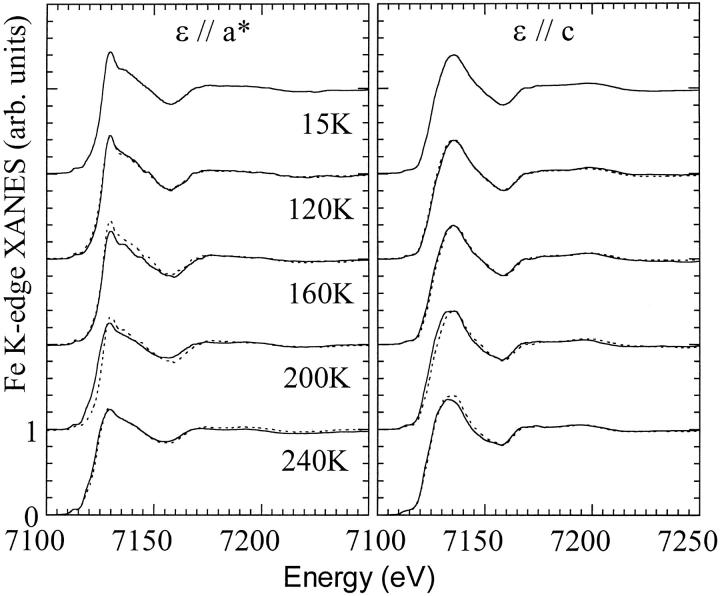
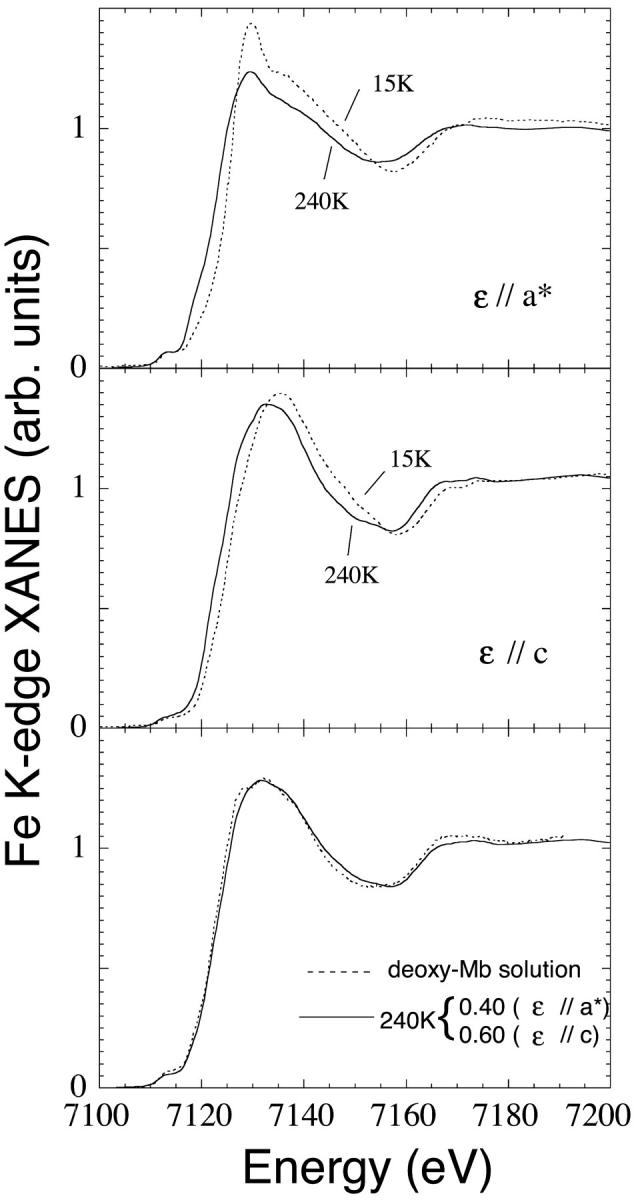
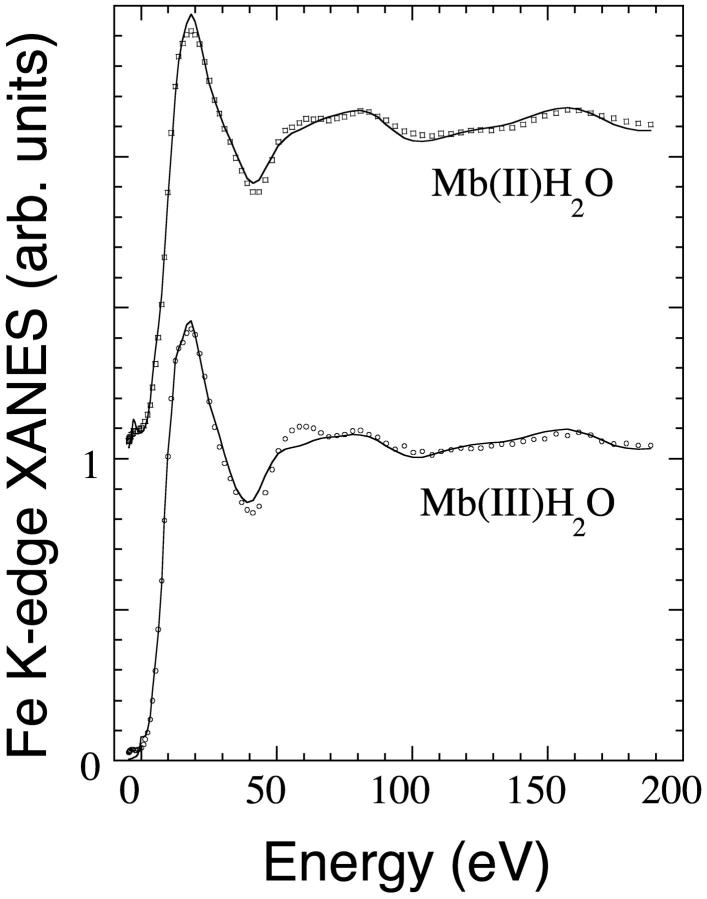
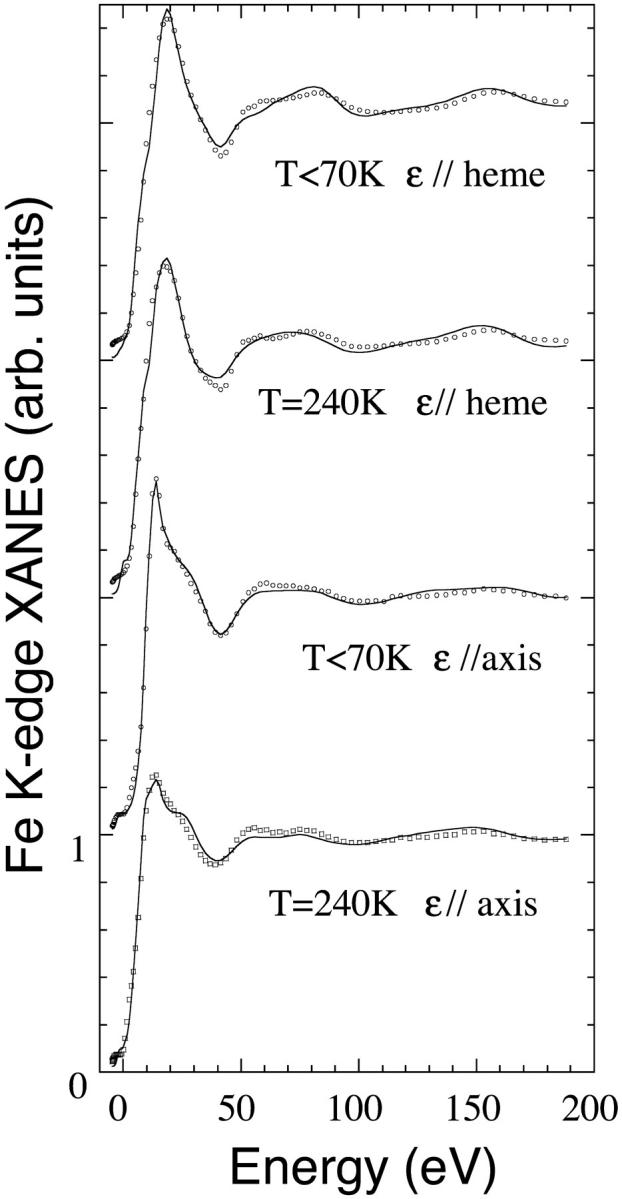
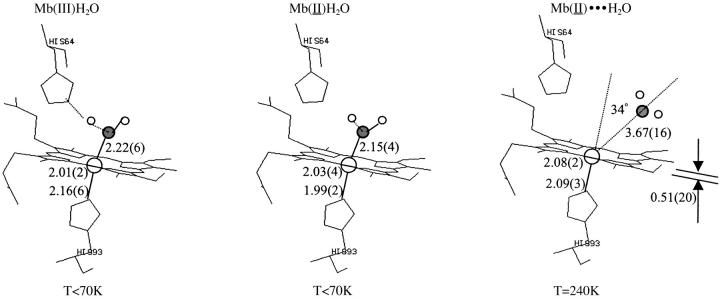
The Fe(III) --> Fe(II) reduction of the heme iron in aquomet-myoglobin, induced by x-rays at cryogenics temperatures, produces a thermally trapped nonequilibrium state in which a water molecule is still bound to the iron. Water dissociates at T > 160 K, when the protein can relax toward its new equilibrium, deoxy form. Synchrotron radiation x-ray absorption spectroscopy provides information on both the redox state and the Fe-heme structure. Owing to the development of a novel method to analyze the low-energy region of x-ray absorption spectroscopy, we obtain structural pictures of this photo-inducible, irreversible process, with 0.02-0.06-A accuracy, on the protein in solution as well as in crystal. After photo-reduction, the iron-proximal histidine bond is shortened by 0.15 A, a reinforcement that should destabilize the iron in-plane position favoring water dissociation. Moreover, we are able to get the distance of the water molecule even after dissociation from the iron, with a 0.16-A statistical error.


Figures

FIGURE 1
FIGURE 1
Fe K-edge XANES spectra of met-myoglobin at pH 7 at T = 70 K, before (Mb(III)H2O, dashed curve), and after prolonged x-ray irradiation at high intensity (Mb(II)H2O, solid curve), The last spectrum (solid curve) probes the Fe-heme structure in the trapped nonequilibrium state. The inset contains a blowup of the pre-edge features, indicating the formation of a low-spin Fe-heme adduct.
FIGURE 2
FIGURE 2
Upper curves are ɛ//a* (dotted curve) and ɛ//c (solid curve) polarized spectra of Mb(II)H2O in a single crystal at T = 70 K. Lower curves are the comparison between the spectra of Mb(II)H2O in solution (solid curve) and in the single crystal (dotted curve). This last spectrum is the 0.4/0.6 linear combination of the ɛ//a* and ɛ//c spectra, respectively.
FIGURE 3
FIGURE 3
Temperature-dependence of the XANES spectra of photo-reduced myoglobin Mb(II)H2O. (Left frame) ɛ//a* spectra, polarized along the Fe-water bond. The thermally activated water dissociation is probed by the spectral changes of the ɛ//a* spectrum between 200 K and 240 K. (Right frame) ɛ//c spectra, polarized on the heme plane. Here, the relaxation of the Fe-heme system, with the displacement of the iron from the heme plane, is probed between 160 K and 240 K. Between 120 K and 160 K, an evidence for a relaxation of the intermediate Mb(II)H2O is observed in both the polarizations.
FIGURE 4
FIGURE 4
Comparison between the first state Mb(II)H2O at T = 70 K and the final state Mb(II)H2O at T = 240 K of the temperature-dependent dissociation process. (Upper frame) Polarization ɛ//a* along the Fe-water bond. (Middle frame) Polarization ɛ//c on the Fe-heme plane. (Lower frame) Comparison between the spectra of the deoxy-Mb(II) in solution obtained by reduction of met-myoglobin with sodium dithionite (solid curvee) and the Mb(II)—H2O final state of our experiment at T = 240 K in single crystal (dotted curve). This last spectrum is the 0.4/0.6 linear combination of the ɛ//a* and ɛ//c spectra, respectively.
FIGURE 5
FIGURE 5
Best fit of the XANES spectra of Mb(III)H2O and Mb(II)H2O in solution at T = 70 K in terms of the selected structural parameters reported in Tables 1 and 2 (solid lines). The experimental data are plotted in circles.
FIGURE 6
FIGURE 6
Best fit of the polarized XANES spectra of Mb(II)H2O at T = 70 K and Mb(II)H2O at T = 240 K in terms of the selected structural parameters reported in Tables 2 and 3 (solid lines). The experimental data are plotted in circles.
FIGURE 7
FIGURE 7
Sketch of the structure of the three main states. The structural data extracted by XANES are reported together with their statistical errors.

References

    1. Benfatto, M., and S. Della Longa. 2001. Geometrical fitting of experimental XANES spectra by a full multiple scattering procedure. J. Synchrotron Rad. 8:1087–1094. - PubMed
    1. Benfatto, M., P. D'Angelo, S. Della Longa, and N.V. Pavel. 2002. Evidence of distorted fivefold coordination of the Cu2+ aqua ion from an x-ray absorption spectroscopy quantitative analysis. Phys. Rev. B. 65:174205.
    1. Blumenfeld, L. 1981. Problems of Biological Physics. Springer-Verlag, Berlin, Germany.
    1. Brunori, M., and Q. H. Gibson. 2001. Cavities and packing defects in the structural dynamics of myoglobin. EMBO Rep. 2:674–679. - PMC - PubMed
    1. Burmeister, W. P. 2000. Structural changes in a cryo-cooled protein crystal owing to radiation damage. Acta Crystallogr. D. 56:328–341. - PubMed

Publication types