Comparative Study
. 2003 Jul;85(1):599-611.
doi: 10.1016/S0006-3495(03)74504-4.

DsRed as a potential FRET partner with CFP and GFP

Affiliations
Comparative Study

DsRed as a potential FRET partner with CFP and GFP

Michael G Erickson et al. Biophys J. 2003 Jul.

Abstract

Fluorescence resonance energy transfer (FRET) between mutant green fluorescent proteins (GFP) provides powerful means to monitor in vivo protein-protein proximity and intracellular messengers. However, the leading FRET pair of this class (CFP/YFP) entails suboptimal donor excitation by Argon lasers, thereby hindering FRET imaging on many confocal microscopes. Further challenges arise from the large spectral overlap of CFP/YFP emission. By contrast, DsRed, along with other members of a growing family of red-shifted sea coral fluorophores, features spectra that could obviate such limitations, using DsRed as FRET acceptor, and GFP or CFP as donor. Nonetheless, DsRed suffers from slow chromophore maturation, which confounds quantitative FRET. Here, we develop strategies minimizing the resulting complexity: 1), Pulsed activation of inducible promoters, driving expression of DsRed-tagged molecules, yields a uniform bolus of mature fluorophore; 2), The 3(3)-FRET detection algorithm, adapted for CFP/DsRed and GFP/DsRed, proves insensitive to distortion by slow maturation. We thus show that DsRed supports strong FRET in CFP-DsRed or GFP-DsRed concatemers. These results reveal the promise of sea coral fluorophores like DsRed as FRET partners with GFP or CFP.


Figures

FIGURE 1
FIGURE 1
Spectral properties favoring DsRed as a FRET partner with GFP or CFP. Excitation (thick lines) and emission (thin lines) spectra collected from suspensions of cells expressing the indicated donor or acceptor fluorophores. Dashed lines indicate the 458- and 488-nm lines of an Argon ion laser.
FIGURE 2
FIGURE 2
Pulsed expression enriches for mature DsRed. (A) Continuous expression of CFP–DsRed concatemer results in dramatic cell color heterogeneity, as visualized by a filter cube having a 470 ± 17.5-nm excitation filter and 515-nm longpass emission filter. With this cube, cells expressing CFP–DsRed vary in color from green (left) to yellow (middle) to orange-red (right), depending on the relative amounts of CFP and mature DsRed. (B) Wide-field view using 515-nm longpass filter cube of cells expressing CFP–DsRed under control of an inducible promoter system. Cells were transfected on “day 1.” Panels show cells, as visualized on day 4, after receiving either continuous treatment with inducing agent on days 2 and 3 (denoted as +/+), or a onetime pulse of inducing agent on day 2 only (+/−). Pulsed induction selects for cells with predominantly mature DsRed, based on their orange-red appearance. (C) Average population counts from (+/+) and (+/−) plates assayed in parallel four days posttransfection, confirming selection for orange-red cells with pulsed expression. Differences between (+/+) and (+/−) for both green-yellow counts and orange-red counts were significant, P < 0.01.
FIGURE 3
FIGURE 3
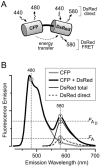
DsRed FRET detection by 33-FRET. (A) Illustration of key excitation and emission wavelengths for 33-FRET analysis of the CFP–DsRed concatemer. (B) Dissection of 580-nm emission with 440-nm excitation. Graph, overall emission spectrum from a single cell expressing CFP–DsRed (thick black line), reflecting underlying CFP (thick gray line) and DsRed (thin black line) spectra. A portion of DsRed emission is due to direct excitation (black dashed line). Points 1–5 are described in the text.
FIGURE 4
FIGURE 4
33-FRET proves insensitive to heterogeneous DsRed maturation. (A) Relationship between FRET measurements (FR, FRET Ratio) by 33-FRET and relative amount of mature DsRed. Top axis, FA/FDA, ratio of DsRed and CFP cube measurements. Bottom axis, fmature, normalized metric for relative amount of mature DsRed. Open symbols, cells continuously expressing CFP–DsRed concatemer under control of a CMV promoter system. Closed symbols, cells in which pulsed induction of CFP–DsRed expression was employed (Fig. 3) to select for cells with predominantly mature DsRed. Horizontal red line indicates average FR for cells with pulsed CFP–DsRed expression. Insensitivity of 33-FRET to DsRed maturation is illustrated by the stability of FR measurements to the right of the dashed vertical line, drawn at fmature = 0.05. Horizontal dashed line indicates FR = 1, or EEFF = 0. (B) Relationship between FRET measurements (F580/F480) by the ratiometric method and relative amount of mature DsRed. Bottom axis same as for A. Red line indicates best fit to data by linear regression. (C) Relationship between FRET measurements (EEFF, FRET efficiency) by CFP dequenching and relative amount of mature DsRed. Bottom axis same as for A. Red line indicates best fit to data by linear regression. Horizontal dashed line indicates EEFF = 0. Bottom color bar indicates the approximate relationship between fmature and cell color, as visualized by a 515-nm longpass filter cube.
FIGURE 5
FIGURE 5
Overexpression can lead to spurious FRET. (A) Analysis of cumulative average FR (FRcum) versus CFP cube measurements (FDA) for cells coexpressing CFP and YFP with strong CMV promoter (closed circles) and weak SV40 promoter (open circles) (Erickson et al., 2001). Dashed line at FDA = 21,000 indicates cutoff beyond which spurious, concentration-dependent FRET becomes apparent, as indicated by the rise in the FRcum plot. (B) Analysis of FRcum vs. FDA for cells coexpressing CFP and DsRed (triangles) and cells expressing CFP–DsRed (squares).
FIGURE 6
FIGURE 6
Sensitive and selective detection of FRET by 33-FRET. Single cell 33-FRET analysis of FRET between GFP (A) or CFP (B) and DsRed. All cells satisfied two selection criteria: fmature > 0.05 (Fig. 4) and FDA < 21,000 (Fig. 5). *, P < 0.01 versus DsRed alone.

Similar articles

Cited by

References

    1. Baird, G. S., D. A. Zacharias, and R. Y. Tsien. 2000. Biochemistry, mutagenesis, and oligomerization of DsRed, a red fluorescent protein from coral. Proc. Natl. Acad. Sci. USA. 97:11984–11989. - PMC - PubMed
    1. Bastiaens, P. I., and T. M. Jovin. 1996. Microspectroscopic imaging tracks the intracellular processing of a signal transduction protein: fluorescent-labeled protein kinase C beta I. Proc. Natl. Acad. Sci. USA. 93:8407–8412. - PMC - PubMed
    1. Bevis, B. J., and B. S. Glick. 2002. Rapidly maturing variants of the Discosoma red fluorescent protein (DsRed). Nat. Biotechnol. 20:83–87. - PubMed
    1. Brody, D. L., P. G. Patil, J. G. Mulle, T. P. Snutch, and D. T. Yue. 1997. Bursts of action potential waveforms relieve G-protein inhibition of recombinant P/Q-type Ca2+ channels in HEK 293 cells. J. Physiol. (Lond.). 499:637–644. - PMC - PubMed
    1. Campbell, R. E., O. Tour, A. E. Palmer, P. A. Steinbach, G. S. Baird, D. A. Zacharias, and R. Y. Tsien. 2002. A monomeric red fluorescent protein. Proc. Natl. Acad. Sci. USA. 99:7877–7882. - PMC - PubMed

Publication types

MeSH terms

Substances