Comparative Study
. 2003 Jul;85(1):623-36.
doi: 10.1016/S0006-3495(03)74506-8.

Tensile force-dependent neurite elicitation via anti-beta1 integrin antibody-coated magnetic beads

Affiliations
Comparative Study

Tensile force-dependent neurite elicitation via anti-beta1 integrin antibody-coated magnetic beads

Joseph N Fass et al. Biophys J. 2003 Jul.

Erratum in

  • Biophys J. 2004 Se[;87(3):623

Abstract

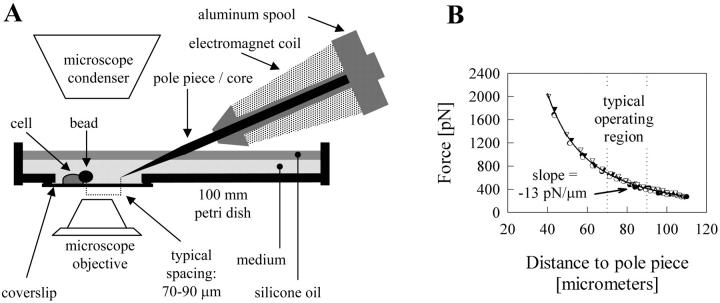
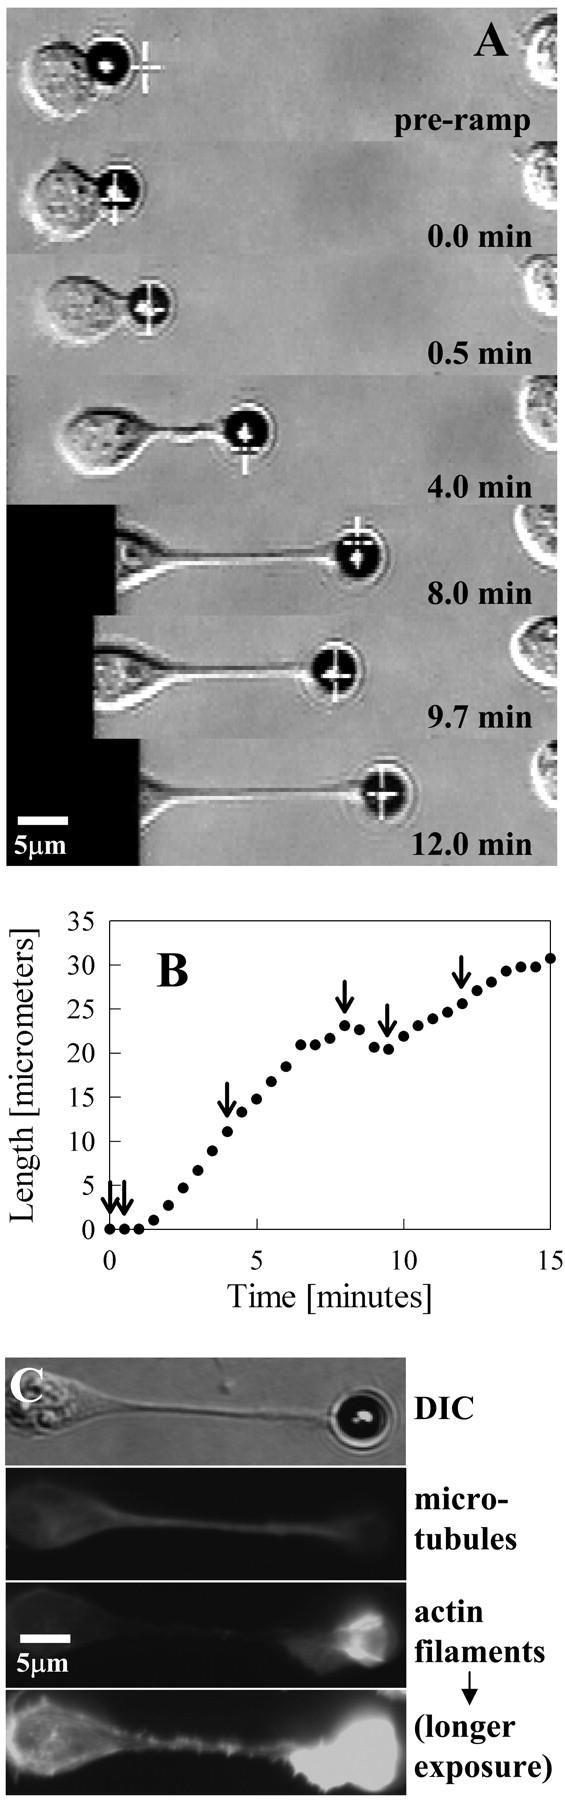
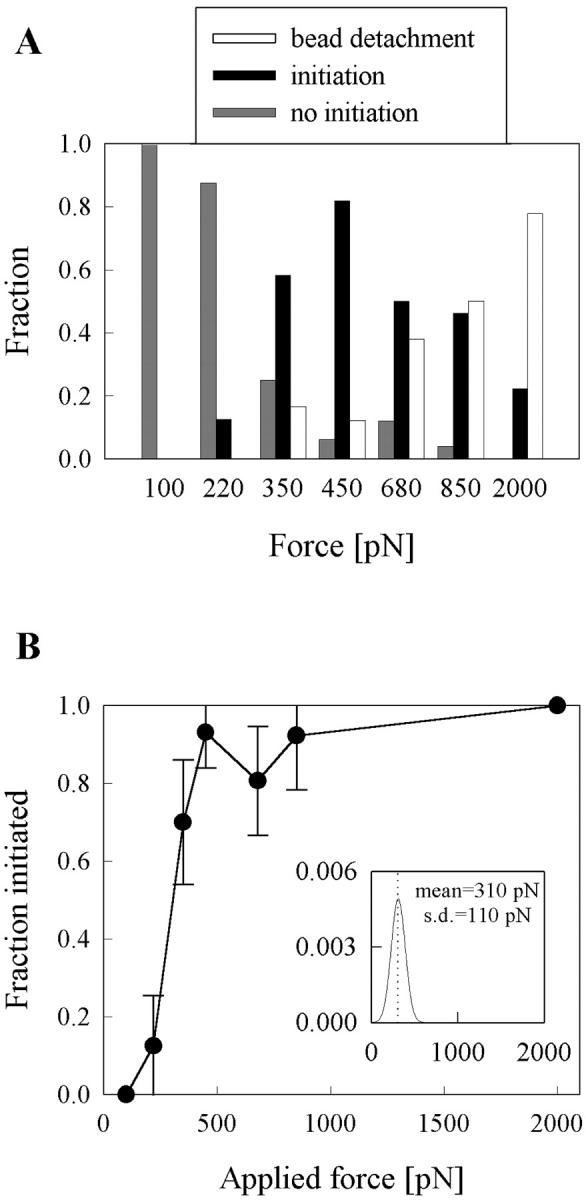
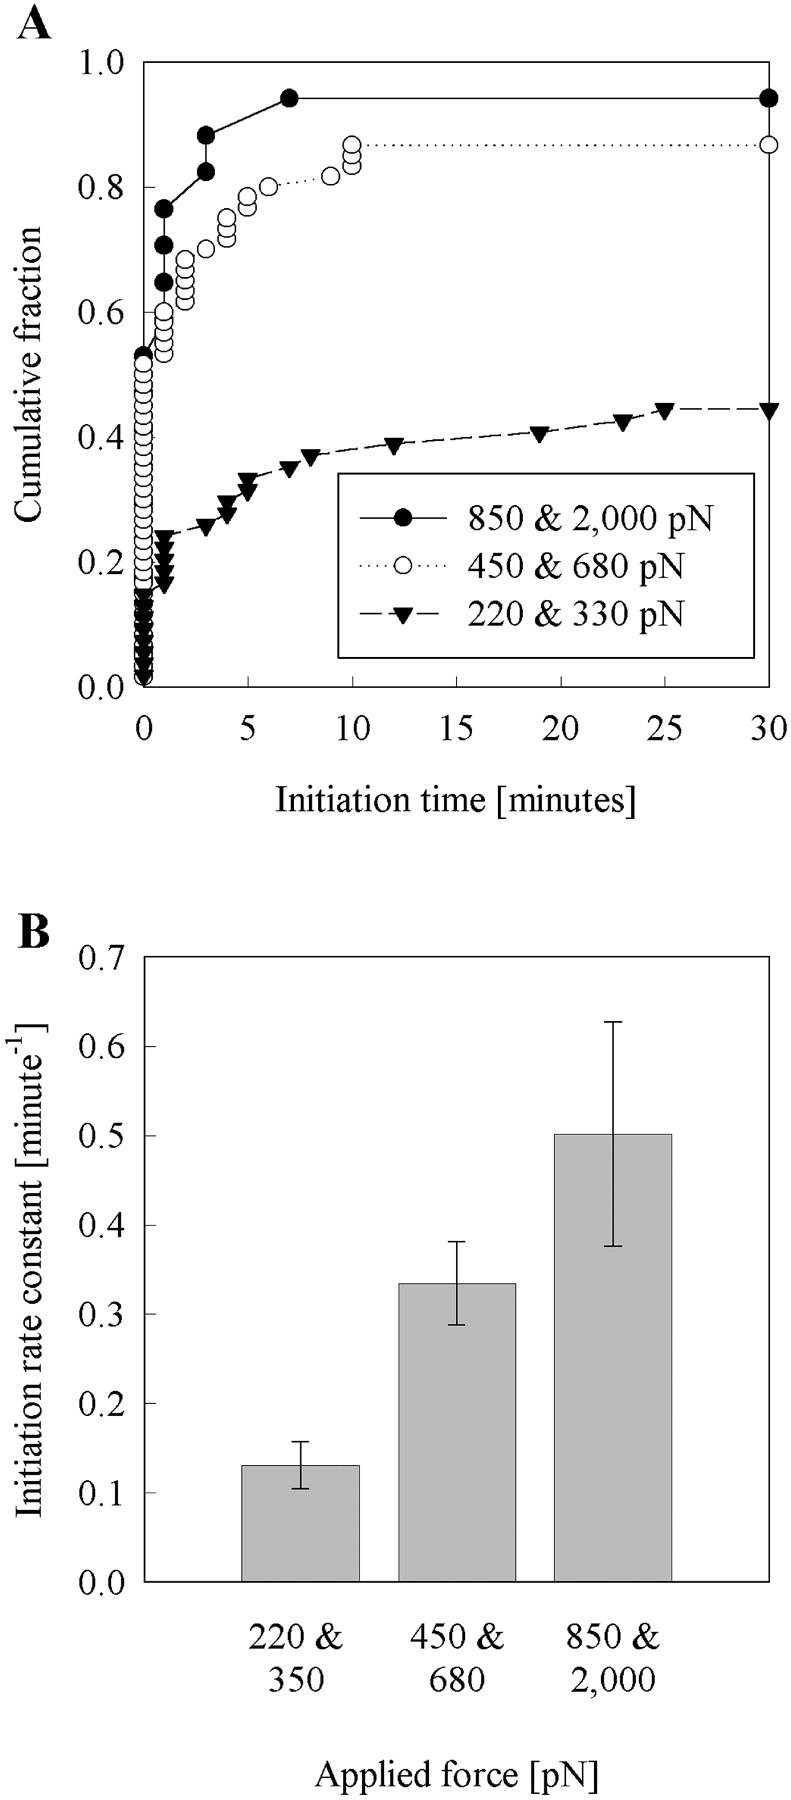
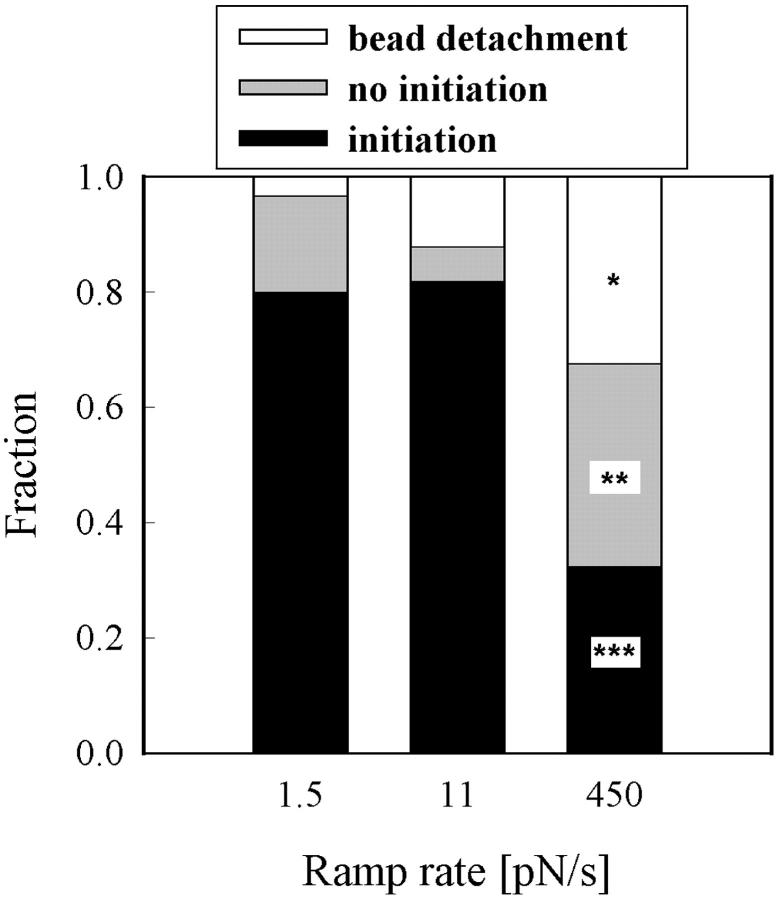
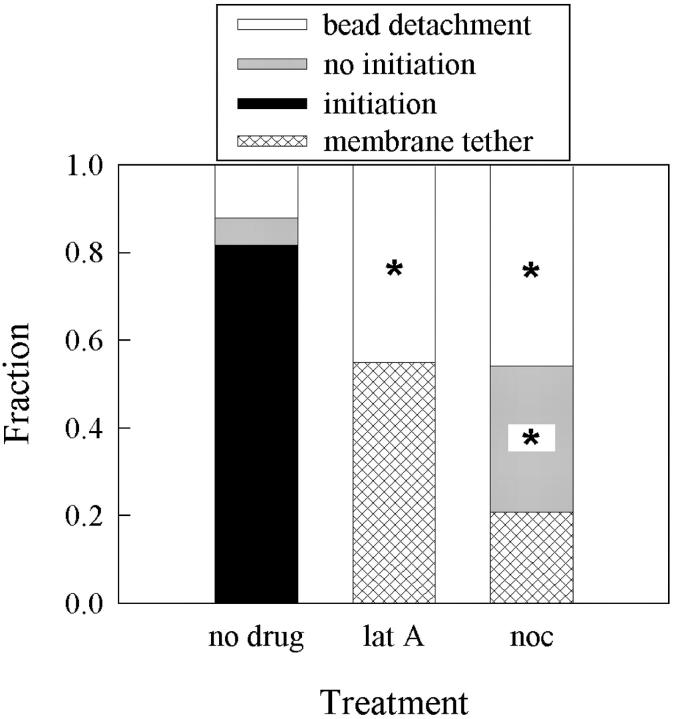
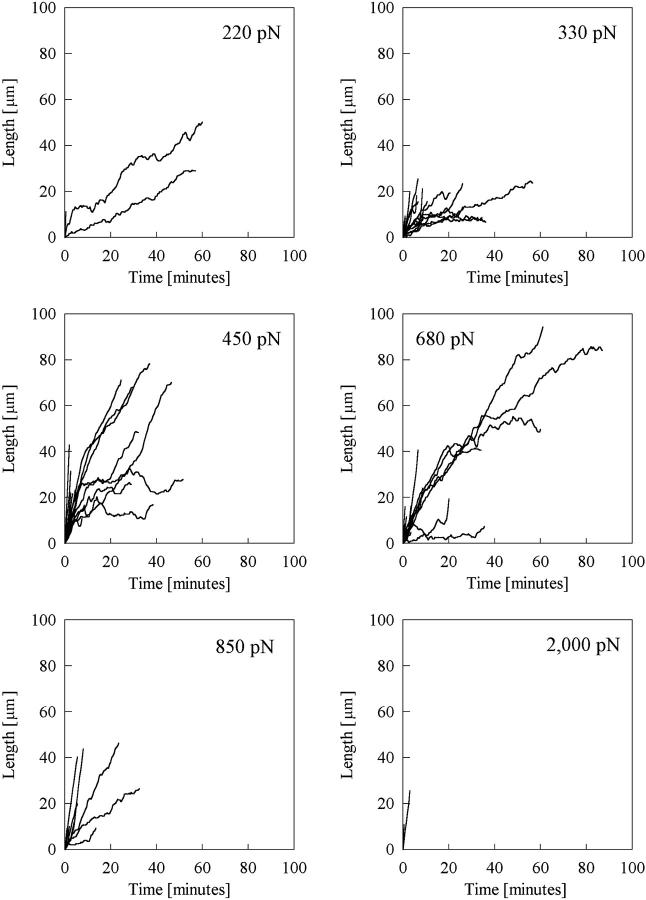
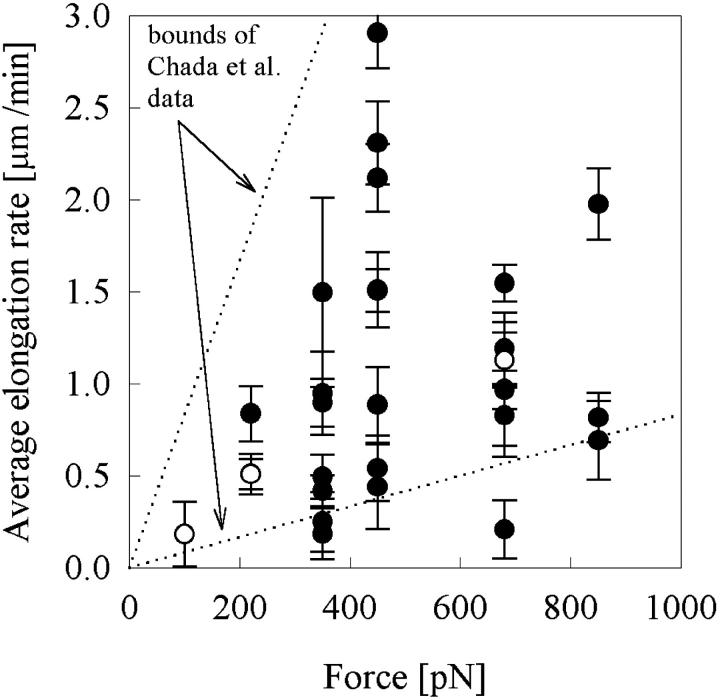
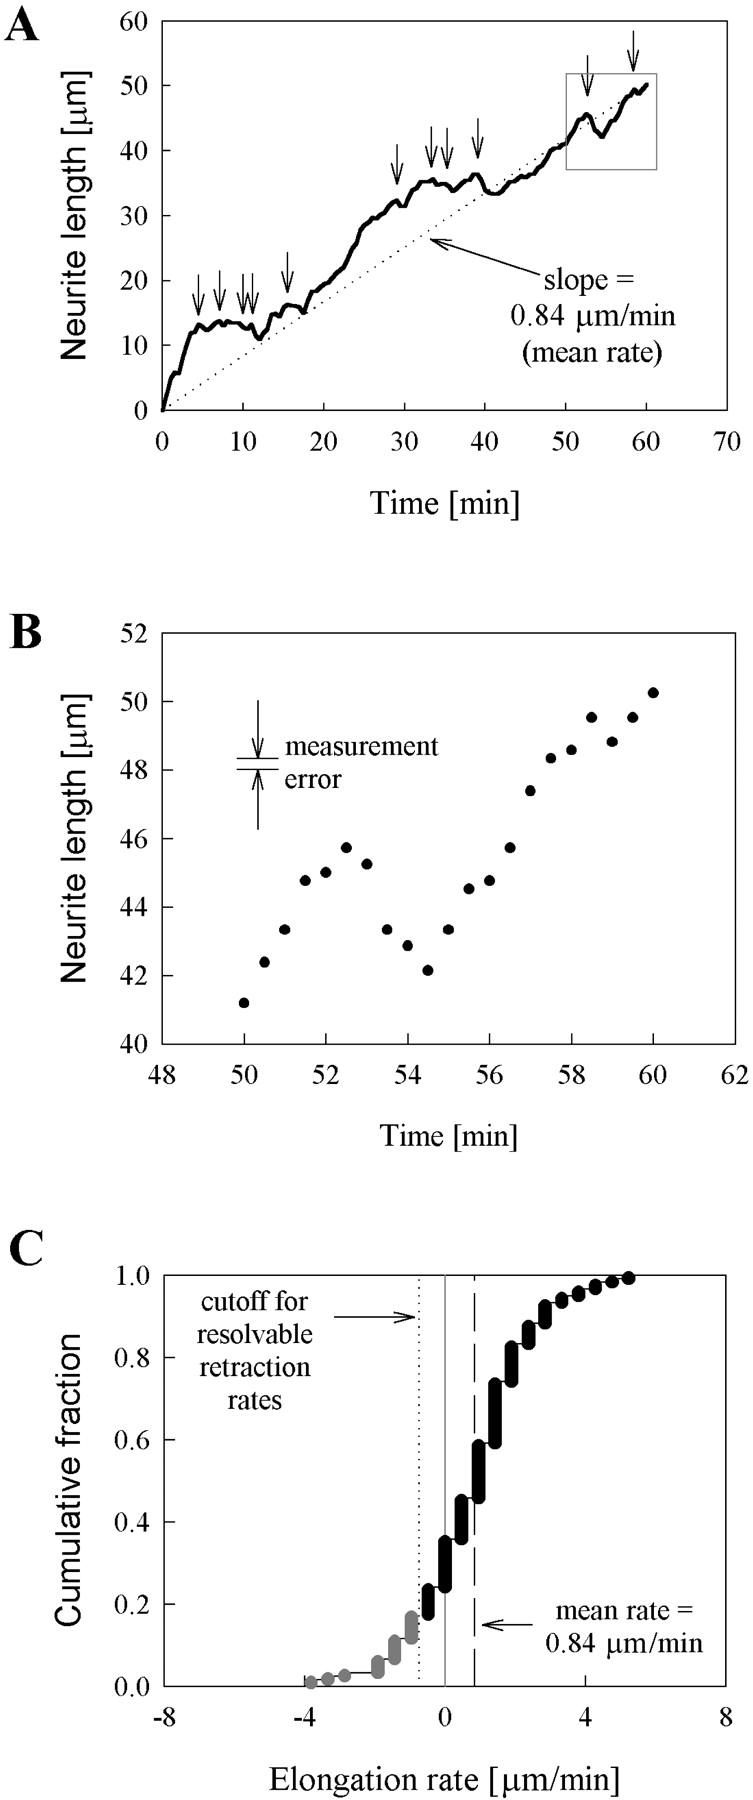
Previous work using glass microneedles to apply calibrated, localized force to neurons showed that tensile force is a sufficient signal for neurite initiation and elongation. However, previous studies did not examine the kinetics or probability of neurite initiation as a function of force or the rate of force application. Here we report the use of a new technique-magnetic bead force application-to systematically investigate the role of force in these phenomena with better ease of use and control over force than glass microneedles. Force-induced neurite initiation from embryonic chick forebrain neurons appeared to be a first-order random process whose rate increased with increasing force, and required the presence of peripheral microtubules. In addition, the probability of initiation was more than twofold lower for neurons exposed to rapid initial force ramps (450 pN/s) than for neurons exposed to slower ramps (1.5 and 11 pN/s). We observed a low force threshold for elongation (15-100 pN), which was not previously detected in chick forebrain neurites elongated by glass microneedles. Finally, neurites subjected to constant force elongated at variable instantaneous rates, and switched abruptly between elongation and retraction, similar to spontaneous, growth-cone-mediated outgrowth and microtubule dynamic instability.


Figures

FIGURE 1
FIGURE 1
Magnetic bead force application. (A) Schematic of the experimental setup, with the electromagnet device shown in cross section. The electromagnet was positioned relative to the stage by a micromanipulator, and the motorized stage was positioned manually via joystick or keyboard control. A layer of silicone oil was used to minimize evaporation during experiments. (B) Sample calibration curve. A power law curve was fit to data from four independent runs with different beads. Much of the variation in a single run came from taking position difference measurements from a digitized image. Power law curve-fits of different runs deviated from each other by an average of ∼2%. The shallow slope of the force-position curve within the typical operating region (e.g., −13 pN/μm at a distance of 80 μm) conferred good control over force, as discussed in Results.
FIGURE 2
FIGURE 2
Characterization of elicited neurites. (A) Neurite initiation and elongation in response to applied force (450 pN). Debris on the surface was used as a fiduciary mark to align images so that the surface (and stage) appears to be stationary; in reality the stage was moved so that the separation between the bead and the pole-piece tip (off camera to right) remained constant. Elongation of the neurite sometimes required movement of the cell body beyond the edge of the camera's field of view, hence the blacked-out regions (at left in images) after 4 min. A cursor (white crosshairs) overlaid by the image processor was used to assist in positioning, which was done manually via computer control of a motorized stage. (B) Neurite length history corresponding to sequence in A. In cases where the cell body moved relative to the surface, lengths were measured from the bead to the right edge of the soma where the membrane appeared to taper to an even caliber. Otherwise, length was judged by movement of the bead relative to stationary surface debris. Arrows indicate time points corresponding to the images in A that were taken during force application. (C) Immunocytochemical staining of a force-initiated process (not the one shown in A) showing the presence of both microtubules and actin filaments in the neurite. As described in Materials and Methods, samples were simultaneously fixed and extracted to reduce background signal from free tubulin subunits.
FIGURE 3
FIGURE 3
(A) Probability of each outcome—neurite initiation, no initiation, and bead detachment—as a function of applied force. All experiments performed with a 40-s initial force ramp are plotted. Sample numbers in each force category are: N = 11 (100 pN), 24 (220 pN), 36 (350 pN), 33 (450 pN), 50 (680 pN), 26 (850 pN), and 18 (2000 pN). Note that neurite initiation reaches a maximum at 450 pN, due to increasing failure to initiate toward lower forces and increasing bead detachment toward higher forces. (B) The fraction of cells (whose beads remained attached) that initiated neurites in response to applied force during the first half-hour of force application is plotted. Error bars represent the 95% confidence interval calculated assuming a binomial distribution of the number of initiation events. Briefly, given the sample probabilities of initiation (p) and no-initiation (q = 1 − p) measured from n samples, the standard deviation expressed as a fraction of the total number of trials is (pq/n)0.5 and the 95% confidence limits are 1.96 × the standard deviation. (Inset) Initiation frequency data were fit with a Gaussian cumulative distribution function (the integral of a Gaussian), and the inset shows the corresponding Gaussian (x-axis is force in pN; y-axis is density in pN−1), which represents the distribution of initiation thresholds. The mean of the probability density function was 310 pN, and the standard deviation was 110 pN. This analysis assumes that at each level of force, all cells with thresholds below that level initiate neurites. Thus, the frequency of initiation at a particular force F, as shown in the main graph, would be determined by the integral of the curve shown in the inset from 0 to F.
FIGURE 4
FIGURE 4
Distribution of initiation times and its dependence on applied force. (A) Cumulative distributions of initiation times are shown for low (220 and 330 pN), medium (450 and 680 pN), and high force (850 and 2000 pN). The mean initiation times at medium and high force are not significantly different by t-test (p = 0.36), but are significantly different between low and medium (p = 0.041) and low and high force (p = 0.020). (B) Constants k, from exponential curves of the form: f = 1 − ekt fit to the distributions in A, increased with increasing force. The probability of an exponential fit for each force regime was tested with Monte Carlo simulation, as follows: simulated data sets of the same size as the experimental sets were generated by using random numbers to generate exponentially distributed initiation times, using the value of k fit to data from each force regime. These simulated times were used to generate a cumulative distribution, and the sum of squared error (SSE) between this distribution and the best fit exponential. This process was repeated 1000 times, and the SSE of the experimental data (relative to the same fitted exponential) was ranked among the simulated SSE's to obtain a p-value (i.e., if the SSE of the experimental data ranked the 100th largest out of 1000 simulated SSE's, then its p-value would be 100/1000 = 0.1). The probabilities of exponential fits were determined to be p = 0.09 (low force), p = 0.33 (medium force), and p = 0.8 (high force).
FIGURE 5
FIGURE 5
The probabilities of neurite initiation, no initiation, and bead detachment are shown as a function of the initial force ramp rate; ultimate force was 450 pN for all ramp rates. Sample sizes in each category were N = 30 (1.5 pN/s), 33 (11 pN/s), and 37 (450 pN/s). The probabilities of each outcome were not significantly different between the two lower ramp rates, but each was significantly different at 450 pN/s than at the two lower ramp rates (*, p < 0.03; **, p < 0.005; ***, and p < 0.001) as tested by Monte Carlo simulation. Briefly, expected outcome frequencies were calculated by lumping the “control” and “test” data together. Then, two groups of the same size as the original data sets were generated by comparing random numbers to these expected frequencies to simulate outcomes. The simulation of the experiment was repeated 1000 times, and the absolute differences in observed outcome frequencies were ranked among the absolute differences obtained from the simulated data sets to obtain a p-value for each category.
FIGURE 6
FIGURE 6
Probability of bead detachment, no initiation, process initiation, and membrane tether formation after treatment with cytoskeletal drugs. Pretreatment with 1 μM latrunculin A for 15 min completely abolished F-actin in most cells. Pretreatment with 6.6 μM nocodazole for 1 h reduced microtubule immunofluorescence dramatically in minor processes, but not in cell bodies. The initial ramp rate was 11.2 pN/s, and the ultimate force was 450 pN for all treatments. Sample sizes in each category were N = 33 (no drug), 20 (lat A), and 24 (noc). Both latrunculin A and nocodazole significantly increased the frequency of bead detachment (*, p < 0.01 as tested by Monte Carlo simulation, described in the caption for Fig. 5). Latrunculin-A-treated cells initiated membrane tethers 55% of the time, and nocodazole treated cells initiated tethers 21% of the time, whereas no membrane tethers were initiated from control cells. Tethers were very thin and uniform in appearance, elongated faster than 250 μm/min, and broke less than 15 s after initiation. In contrast, all processes initiated from control cells elongated slower than 50 μm/min (most elongated at ∼0.5–5.0 μm/min), and only five out of 26 thinned and broke less than 1 min after initiation. Finally, nocodazole-treated cells retained their attached beads but failed to initiate a process 33% of the time (no-initiation category), compared to 6% of the time for untreated cells.
FIGURE 7
FIGURE 7
Neurite-length histories for all experiments with constant ramp-time. Length histories were constructed by taking length measurements at 30-s intervals from time-lapse video recordings. Duplicate measurements by the same or a different person had RMS deviations of typically 0.26 μm. These length histories illustrate several features discussed in the text: variability in average and short-term elongation rate, and spontaneous reversals. Experiments in which ramp time was varied are not shown, but length histories from these experiments exhibited similar features.
FIGURE 8
FIGURE 8
Average elongation rates of robust neurites as a function of force (solid circles; 26 neurites). Also plotted (unfilled circles) are three rates from neurites that initiated after 30 min from the onset of force application. Error bars are mean ± SE, calculated from the distribution of instantaneous rates taken at 30-s intervals for each neurite. Previously reported rates for force-induced chick forebrain neurite elongation (Chada et al., 1997) fall in the region between the dotted lines. Note that Chada and co-workers did not observe a minimum force for elongation (hence the zero intercept of the lines), whereas we observed retraction of all neurites tested at 15 pN (data not shown).
FIGURE 9
FIGURE 9
Characterization of short-term neurite elongation rate variability. (A) A single length history (of a neurite initiated and elongated at 220 pN) is shown, with all resolvable retractions indicated by arrows. We considered a negative length change (occurring over one or more 30-s interval) to be a retraction if its value was >0.37 μm (the expected RMS error for a difference measurement between two consecutive lengths, each with an RMS error of 0.26 μm). The mean elongation rate was calculated from the final length and time (equivalently, the slope of the line through the origin and the final point). (B) The region of interest indicated by the box in A is shown, enlarged, along with an indicator of the RMS measurement error (0.26 μm). (C) Rates of length change were calculated from the 30-s interval length data used in A, to calculate the cumulative distribution of instantaneous rates. The cumulative distributions of each of the 29 robust neurites were individually similar in appearance to the distribution plotted in C. Also indicated are the cutoff value for resolvable retractions (i.e., rates <0.37/0.5 μm/min = 0.74 μm/min) and the mean elongation rate for this neurite.

Similar articles

Cited by

References

    1. Ahmad, F. J., J. Hughey, T. Wittmann, A. Hyman, M. Greaser, and P. W. Baas. 2000. Motor proteins regulate force interactions between microtubules and microfilaments in the axon. Nat. Cell Biol. 2:276–280. - PubMed
    1. Alenghat, F. J., B. Fabry, K. Y. Tsai, W. H. Goldmann, D. E. Ingber. 2000. Analysis of cell mechanics in single vinculin-deficient cells using a magnetic tweezer. Biochem. Res. Commun. 277:93–99. - PubMed
    1. Baas, P. W. 2002. Microtubule transport in the axon. Int. Rev. Cytol. 212:41–62. - PubMed
    1. Baas, P. W., and F. J. Ahmad. 2001. Force generation by cytoskeletal motor proteins as a regulator of axonal elongation and retraction. Trends Cell Biol. 11:244–249. - PubMed
    1. Bausch, A. R., U. Hellerer, M. Essler, M. Aepfelbacher, and E. Sackmann. 2001. Rapid stiffening of integrin receptor-actin linkages in endothelial cells stimulated with thrombin: a magnetic bead microrheology study. Biophys. J. 80:2649–2657. - PMC - PubMed

Publication types

MeSH terms

LinkOut - more resources