. 2003 Jul;52(7):1695-1700.
doi: 10.2337/diabetes.52.7.1695.

HIV protease inhibitors acutely impair glucose-stimulated insulin release

Affiliations

HIV protease inhibitors acutely impair glucose-stimulated insulin release

Joseph C Koster et al. Diabetes. 2003 Jul.

Abstract

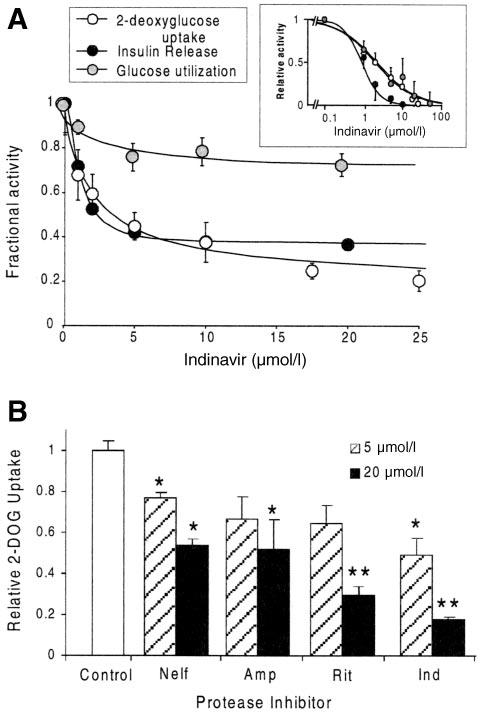
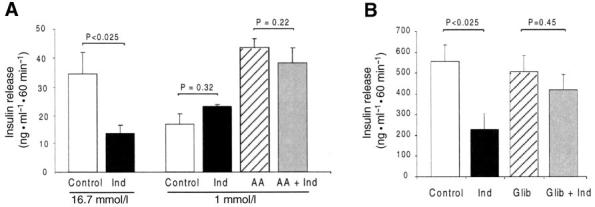
HIV protease inhibitors (PIs) acutely and reversibly inhibit the insulin-responsive glucose transporter Glut 4, leading to peripheral insulin resistance and impaired glucose tolerance. Minimal modeling analysis of glucose tolerance tests on PI-treated patients has revealed an impaired insulin secretory response, suggesting additional pancreatic beta-cell dysfunction. To determine whether beta-cell function is acutely affected by PIs, we assayed glucose-stimulated insulin secretion in rodent islets and the insulinoma cell line MIN6. Insulin release from MIN6 cells and rodent islets was significantly inhibited by the PI indinavir with IC(50) values of 1.1 and 2.1 micro mol/l, respectively. The uptake of 2-deoxyglucose in MIN6 cells was similarly inhibited (IC(50) of 2.0 micro mol/l), whereas glucokinase activity was unaffected at drug levels as high as 1 mmol/l. Glucose utilization was also impaired at comparable drug levels. Insulin secretogogues acting downstream of glucose transport mostly reversed the indinavir-mediated inhibition of insulin release in MIN6 cells. Intravenous infusion of indinavir during hyperglycemic clamps on rats significantly suppressed the first-phase insulin response. These data suggest that therapeutic levels of PIs are sufficient to impair glucose sensing by beta-cells. Thus, together with peripheral insulin resistance, beta-cell dysfunction likely contributes to altered glucose homeostasis associated with highly active antiretroviral therapy.


Figures

FIG. 1
FIG. 1
Insulin release from purified mouse islets. A: Measured insulin release (ng/10 islets) from isolated mouse islets incubated for 10 min in medium supplemented with basal (1 mmol/l) or stimulatory (7 and 16.7 mmol/l) glucose ± indinavir (20 μmol/l). Each symbol represents the mean ± SE of three separate experiments from islets isolated from two mice. B: Dependence of insulin secretion on [indinavir] (mean + SE, relative to insulin secretion in zero indinavir) for purified islets (10/well, duplicate wells) stimulated with 16.7 mmol/l glucose. Data points represent the mean ± SE (n = 6, from pooled islets isolated from 12 mice). The fitted line corresponds to a least-squares fit of the Hill equation (relative insulin release = [1 — offset/(1 + ([indinavir]/IC50) H)] + offset), with the Hill coefficient (H) and offset, representing indinavir-insensitive insulin release, allowed to vary; offset = 35%, H = 1.9, and IC50 = 2.1 μmol/l. C: Relative insulin release at 16.7 mmol/l glucose in the presence of 20 μmol/l of the indicated PIs nelfinavir (Nelf), amprenavir (Amp), ritonavir (Rit), and indinavir (Ind). Data points represent the mean ± SE of three independent experiments. *P < 0.05 and **P < 0.01 compared with ethanol-treated control islets (unpaired Student's t test).
FIG. 2
FIG. 2
Reversibility of indinavir effects on insulin release. Insulin release was assayed from isolated mouse islets incubated for 1 h in medium supplemented with 16.7 mmol/l glucose ± indinavir (20 μmol/ l). After incubation, islets were washed in complete DMEM for2hand insulin release was assayed without indinavir. Data are normalized as fractional percentage of the control value and expressed as the mean ± SE (n = 3 from pooled islets isolated from six mice). P values by unpaired Student's t test.
FIG. 3
FIG. 3
Effects of indinavir on 2-deoxyglucose uptake in MIN6 cells. A: MIN6 cells were preincubated for 2 min with varying concentrations of indinavir, and [3H]2-deoxyglucose uptake was assayed during a 6-min incubation period. In addition, insulin release and glucose utilization were assayed separately in MIN6 cells after a 1-h incubation with varying [indinavir]. Each symbol represents the mean ± SE of three separate experiments performed in duplicate. IC values of 1.1, 2.0, and 2.2 μmol/l were calculated for insulin release, glucose uptake, and glucose utilization, respectively, using a least-squares fit of the Hill equation as described in Fig. 1. Offsets of 18, 37, and 69% and Hill coefficients of 0.9, 1.8, and 0.9 were calculated for glucose uptake, insulin release, and glucose utilization, respectively. Inset: For comparison of only the indinavir-sensitive components, offsets were subtracted from data in A and replotted on a logarithmic scale, with the Hill coefficients and IC values the same as above. B: [3H]2-deoxyglucose (2-DOG) uptake in MIN6 cells was assayed in the presence of 5 or 20 μmol/l of the indicated PIs. Bars represent mean ± SE of three separate experiments performed in triplicate. *P < 0.05 and **P < 0.01 as compared with control by unpaired Student's t test.
FIG. 4
FIG. 4
Effect of PIs on insulin release by downstream insulin secretogogues. A: Insulin release from isolated mouse islets (10/well) was assayed in 1 mmol/l glucose with indinavir (20 μmol/l) or a glutamine/leucine mix (10 mmol/l each) alone or in combination. Bars represent mean ± SE of at least three separate experiments. For comparison, the inhibitory effect of indinavir (20 μmol/l) on glucose-induced insulin release (16.7 mmol/l) is shown. Data are representative of three independent experiments. Bars indicate mean ± SE of three to four assays per group. P values by Student's t test. B: Insulin release from MIN6 cells was assayed in 16.7 mmol/l glucose with indinavir (20 μmol/l) or glibenclamide (1 μmol/l) alone or in combination. Bars represent mean ± SE of three separate experiments. P values by paired Student's t test.
FIG. 5
FIG. 5
Effects of indinavir on insulin secretion during hyperglycemic clamps. Catheters were inserted into carotid arteries and jugular veins of 200- to 300-g male Wistar rats 4 days before experiments. A constant intravenous infusion of indinavir or water vehicle was as started at a rate of 0.5 mg • kg-1 • min-1 30 min before each clamp. Indinavir levels reached levels of 25-30 μmol/l during the period of drug infusion. Hyperglycemic clamps were performed using dextrose (50%) infused through the venous catheter at a rate sufficient to maintain a plasma glucose level of 200 mg/dl during the assay period. During the hyper-glycemic clamp (2 h), blood samples were taken every 2 min during the first 10 min and every 10 min thereafter and assayed for blood glucose (A) and insulin (B) levels. B: Inset: first-phase insulin response (0-10 min) in PI-treated compared with control animals. Control rats: n = 8; PI-treated rats: n = 8. *P < 0.05 by unpaired Student's t test.

References

    1. Palella FJ, Jr, Delaney KM, Moorman AC, Loveless MO, Fuhrer J, Satten GA, Aschman DJ, Holmberg SD. Declining morbidity and mortality among patients with advanced human immunodeficiency virus infection. HIV Outpatient Study Investigators. N Engl J Med. 1998;338:853–860. - PubMed
    1. Carr A, Samaras K, Burton S, Law M, Freund I, Chisholm DJ, Cooper DA. A syndrome of peripheral lipodystrophy, hyperlipidemia and insulin resistance in patients receiving HIV protease inhibitors. AIDS. 1998;12:F51–F58. - PubMed
    1. Vigouroux C, Gharakhanian S, Salhi Y, Nguyen TH, Chevenne D, Capeau J, Rozenbaum W. Diabetes, insulin resistance and dyslipidaemia in lipodystrophic HIV-infected patients on highly active antiretroviral therapy (HAART) Diabetes Metab. 1999;25:225–232. - PubMed
    1. Hadigan C, Meigs JB, Corcoran C, Rietschel P, Piecuch S, Basgoz N, Davis B, Sax P, Stanley T, Wilson PW, D‘Agostino RB, Grinspoon S. Metabolic abnormalities and cardiovascular disease risk factors in adults with human immunodeficiency virus infection and lipodystrophy. Clin Infect Dis. 2001;32:130–139. - PubMed
    1. Murata H, Hruz PW, Mueckler M. The mechanism of insulin resistance caused by HIV protease inhibitor therapy. J Biol Chem. 2000;275:20251–20254. - PubMed

Publication types