Comparative Study
. 2003 Jul 8;100(14):8395-400.
doi: 10.1073/pnas.1332805100. Epub 2003 Jun 26.

Mouse V alpha 14i natural killer T cells are resistant to cytokine polarization in vivo

Affiliations
Comparative Study

Mouse V alpha 14i natural killer T cells are resistant to cytokine polarization in vivo

Jennifer L Matsuda et al. Proc Natl Acad Sci U S A. .

Abstract

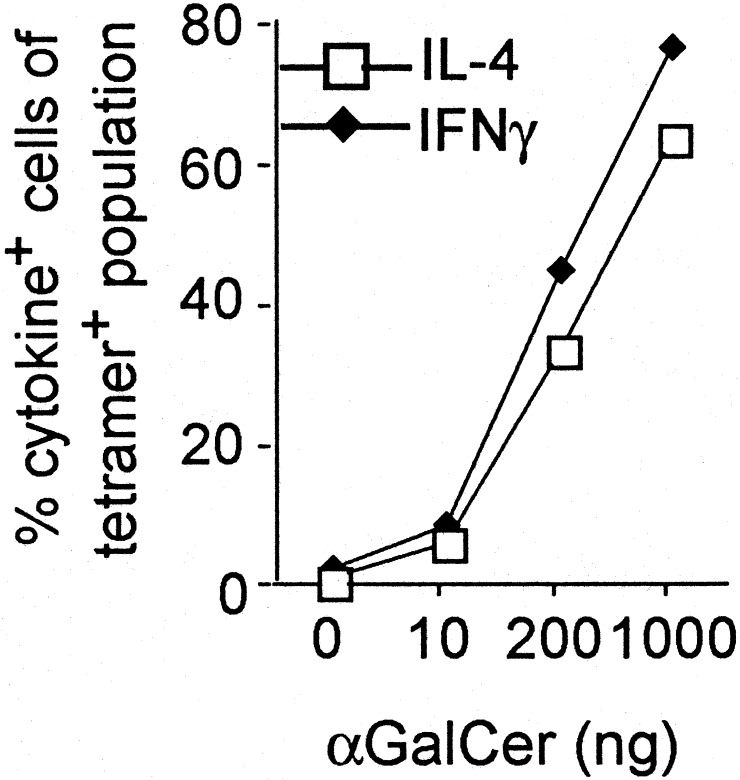
Under different circumstances, natural killer T (NKT) cells can cause a T helper (Th) 1 or a Th2 polarization of immune responses. We show here, however, that mouse NKT cells with an invariant V alpha 14 rearrangement (V alpha 14i NKT cells) rapidly produce both IL-4 and IFN-gamma, and this pattern could not be altered by methods that polarize naive CD4+ T cells. Surprisingly, although cytokine protein was detected only after activation, resting V alpha 14i NKT cells contained IL-4 and IFN-gamma mRNAs. Despite this finding, in vivo priming of mice with the glycolipid antigen recognized by V alpha 14i NKT cells resulted in a more Th2-oriented response upon antigen re-exposure. The V alpha 14i NKT cells from primed mice retain the ability to produce IL-4 and IFN-gamma, but they are less effective at activating NK cells to produce IFN-gamma. Our data therefore indicate that V alpha 14i NKT cells have a relatively inflexible immediate cytokine response, but that changes in their ability to induce IFN-gamma secretion by NK cells may determine the extent to which they promote Th1 responses.


Figures

Fig. 1.
Fig. 1.
The effect of antigen dose on the cytokine response of Vα14i T cells. Percentage of CD1d tetramer+ cells in the liver that stained for intracellular IL-4 (□) or IFN-γ (⋄) as a function of the dose of αGalCer given to C57BL/6 mice 2 h previously. n = 2–3 for each condition, with at least two independent experiments performed for each case.
Fig. 2.
Fig. 2.
The effect of cytokine receptor deficiency and CD40 on cytokine synthesis by Vα14i T cells. (A) Intracellular cytokine detection. The left column shows staining for CD1d tetramer+ TCRβ+ liver mononuclear cells from uninjected BALB/c, IL-4Rα-/-, and IL-12Rβ2-/- mice. Also shown is intracellular cytokine staining of liver mononuclear cells 90 min after i.v. administration of vehicle (columns 2 and 4) or 2 μgof αGalCer (columns 3, 5, and 6). Between 89% and 95% of CD1d tetramer+ TCRβ+ cells stained for intracellular IL-4 and IFN-γ. For vehicle-injected control mice and isotype control staining of αGalCer-injected mice, the percentage of CD1d tetramer+ TCRβ+ cells that were positive for either IL-4 and IFN-γ or for the isotype mAb was <3.5%. Three mice from each strain were injected. Two independent experiments were performed with similar results. (B) Serum cytokine levels. BALB/c controls, IL-4Rα-/-, and IL-12Rβ2-/- mice were analyzed 2 or 6 h after i.v. injection of 2 μg of αGalCer. At 2 h, BALB/c mice (n = 6), IL-4Rα-/- mice (n = 4), and IL-12Rβ2-/- mice (n = 6) were analyzed. At 6 h, BALB/c mice (n = 4), IL-4Rα-/- mice (n = 2), and IL-12Rβ2-/- mice (n = 4) were analyzed. Statistical analysis was performed by using t tests to compare cytokine levels for all strains at each time point, and significant differences are indicated. *, P = 0.02; **, P = 0.01. (C) Intracellular cytokine staining of liver lymphocytes 2 h after i.v. injection of 2 μgof αGalCer in C57BL/6 WT controls (n = 2) or CD40-/- mice (n = 2). Percentage of CD1d tetramer+ TCRβ+ cells that were positive for IL-4 and IFN-γ ranged from 87% to 94%, whereas staining with the isotype control mAb was <5%.
Fig. 3.
Fig. 3.
Resting Vα14i T cells contain cytokine mRNA. (A) Vα14i T cells in the liver and spleen of 4get (IL-4 locus) and Yeti (IFN-γ locus) mice were analyzed for their expression of eGFP (IL-4 mRNA) and eYFP (IFN-γ). Histogram panels are data from gated αGalCer/CD1d tetramer+ TCRβ+ cells. (B) Conventional T cells in the spleen do not express eGFP or eYFP. Histogram panels are gated on T cells (CD1d tetramer- CD8- TCRβ+). (C) Vα14i T cells in the liver of 4get and Yeti mice were analyzed for their expression of eGFP and eYFP after in vivo stimulation with αGalCer. Similar results were obtained from the spleen (data not shown). Histogram panels are gated on αGalCer/CD1d tetramer+ TCRβ+ cells. Each of the plots represents pooled cells from three mice. Two individual experiments were performed with similar results. (D) IL-4 and IFN-γ mRNA are present in Vα14i T cells from WT mice. Real-time PCR was performed with primers specific for IL-4 and IFN-γ by using cDNA prepared from Vα14i T cells and CD4+ T cells (CD1d tetramer-) sorted from the spleen and liver of C57BL/6 mice. Cytokine amplicons were normalized against the levels of hypoxanthine phosphoribosyltransferase amplified in each sorted population. Statistical analysis was performed by using t tests to compare the levels of cytokine messenger detected in tetramer+ cells versus CD4+ tetramer- cells. *, P < 0.05.
Fig. 4.
Fig. 4.
Cytokine production by Vα14i T cells in αGalCer-primed mice. (A) IL-4 and IFN-γ in the sera were measured by ELISA 2 or 6 h after injection of αGalCer into naïve mice or C57BL/6 mice primed 1 week earlier. BD, below detection. At 2 h, five naïve mice and five primed mice were analyzed. At 6 h, nine naïve mice and seven primed mice were analyzed. Statistical analysis was performed by using t tests to compare the levels of each cytokine at each time point for naïve versus primed mice. For all comparisons, P < 0.05. IFN-γ levels at 6 h in naïve versus primed mice, P = 0.01. (B) Intracellular cytokine staining of liver lymphocytes 2 h after i.v. injection of 2 μgof αGalCer in naïve or primed mice. Percentage of CD1d tetramer+ TCRβ+ cells that were positive for IL-4 and IFN-γ ranged from 83% to 94%. The percentage of CD1d tetramer+ TCRβ+ cells isolated from naïve mice ranged from 16% to 24% whereas the percentage of CD1d tetramer+ TCRβ+ cells in primed mice ranged from 2% to 5%. Data are representative of eight naïve mice and seven primed mice analyzed with similar results.
Fig. 5.
Fig. 5.
NK cells in αGalCer-primed mice and IL-12Rβ2-/- mice produce less IFN-γ.(A) Intracellular IFN-γ content of DX5+TCRβ- cells from the liver 6 h after αGalCer injection. Percentages of IFN-γ+ (boldface line) or isotype+ cells are indicated. One representative mouse is shown for each strain. For WT, n = 5; primed mice, n = 5; and IL-12Rβ2-/- mice, n = 4. (B) Comparison of IFN-γ levels in sera 6 h after αGalCer injection in WT, asialo-GM1 treated, and IL-12Rβ2-/- mice. One representative experiment of two is shown. Statistical analysis was performed by using t tests to compare IFN-γ levels in WT versus GM1-treated and IL-12Rβ2-/- mice. *, P = 0.003; **, P = 0.005.

References

    1. Kawano, T., Cui, J., Koezuka, Y., Toura, I., Kaneko, Y., Motoki, K., Ueno, H., Nakagawa, R., Sato, H., Kondo, E., et al. (1997) Science 278 1626-1629. - PubMed
    1. Burdin, N., Brossay, L., Koezuka, Y., Smiley, S. T., Grusby, M. J., Gui, M., Taniguchi, M., Hayakawa, K. & Kronenberg, M. (1998) J. Immunol. 161 3271-3281. - PubMed
    1. Kronenberg, M. & Gapin, L. (2002) Nat. Rev. Immunol. 2 557-568. - PubMed
    1. Gombert, J. M., Herbelin, A., Tancrede-Bohin, E., Dy, M., Carnaud, C. & Bach, J.-F. (1996) Eur. J. Immunol. 26 2989-2998. - PubMed
    1. Zeng, D., Lewis, D., Dejbakhsh-Jones, S., Lan, F., Garcia-Ojeda, M., Sibley, R. & Strober, S. (1999) J. Exp. Med. 189 1073-1081. - PMC - PubMed

Publication types

MeSH terms