. 2003 Jul;23(14):4753-63.
doi: 10.1128/MCB.23.14.4753-4763.2003.

Variegated expression from the murine band 3 (AE1) promoter in transgenic mice is associated with mRNA transcript initiation at upstream start sites and can be suppressed by the addition of the chicken beta-globin 5' HS4 insulator element

Affiliations

Variegated expression from the murine band 3 (AE1) promoter in transgenic mice is associated with mRNA transcript initiation at upstream start sites and can be suppressed by the addition of the chicken beta-globin 5' HS4 insulator element

Tiffany F Frazar et al. Mol Cell Biol. 2003 Jul.

Abstract

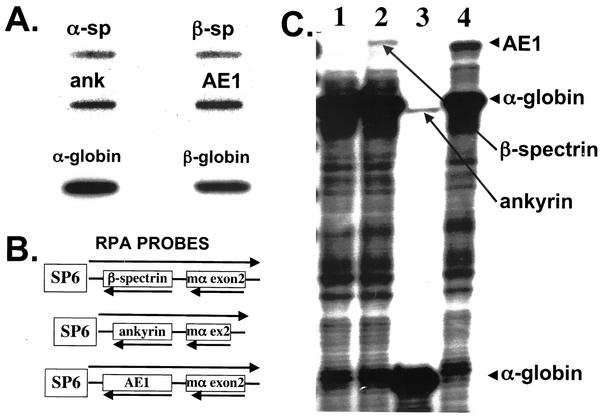
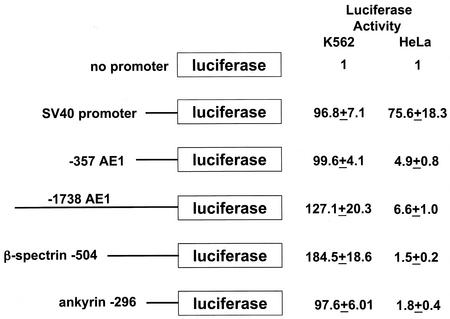
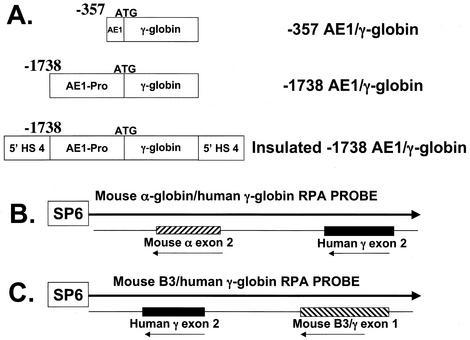
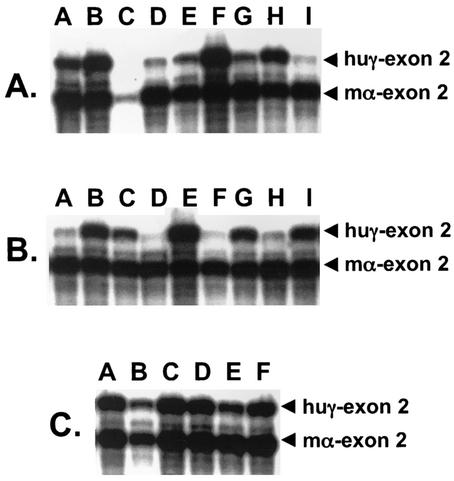
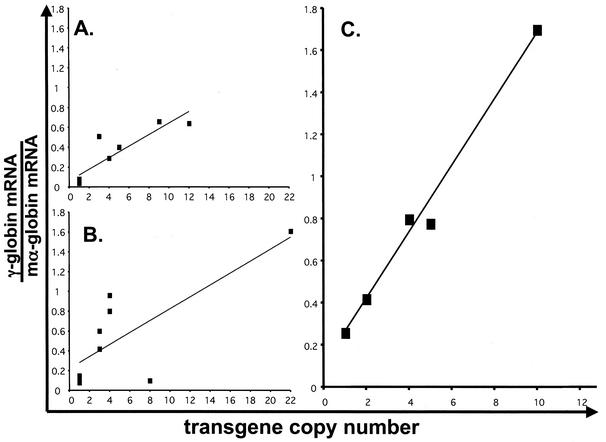
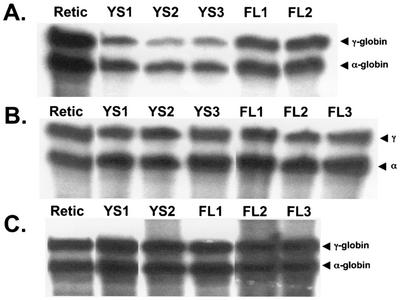
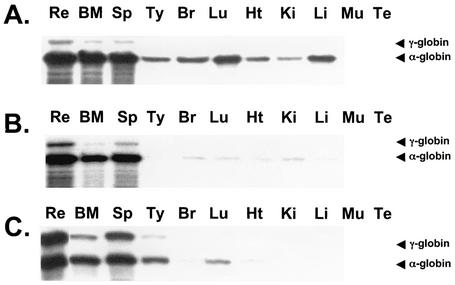
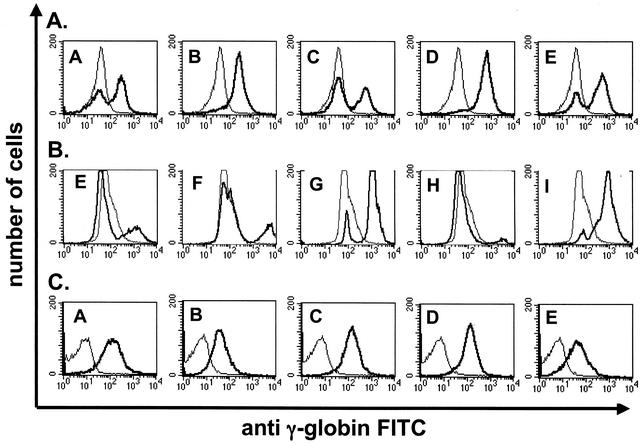
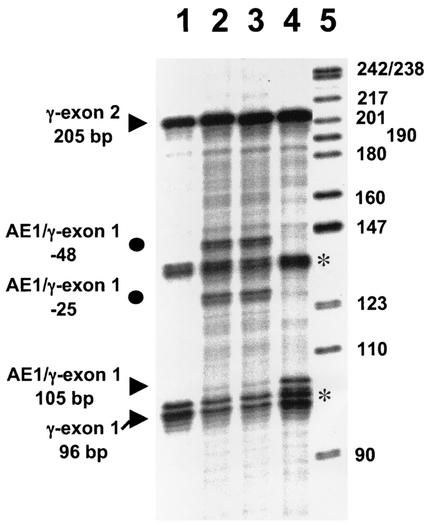
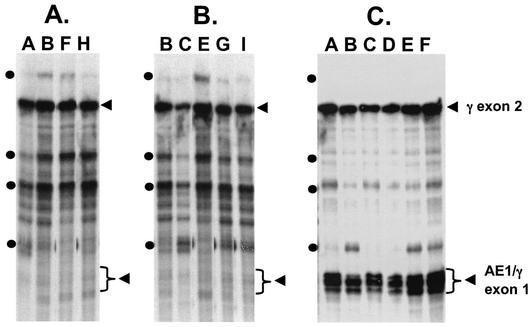
The anion exchanger protein 1 (AE1; band 3) is an abundant erythrocyte transmembrane protein that regulates chloride-bicarbonate exchange and provides an attachment site for the erythrocyte membrane skeleton on the cytoplasmic domain. We analyzed the function of the erythroid AE1 gene promoter by using run-on transcription, RNase protection, transient transfection, and transgenic mouse assays. AE1 mRNA was transcribed at a higher level and maintained at a higher steady-state level than either ankyrin or beta-spectrin in mouse fetal liver cells. When linked to a human gamma-globin gene, two different AE1 promoters directed erythroid-specific expression of gamma-globin mRNA in 18 of 18 lines of transgenic mice. However, variegated expression of gamma-globin was observed in 14 of 18 lines. While there was a significant correlation between transgene copy number and the amount of gamma-globin mRNA in all 18 lines, the transgene mRNAs initiated upstream of the start site of the endogenous AE1 mRNA. Addition of the insulator element from 5'HS4 of the chicken beta-globin cluster to the AE1/gamma-globin transgene allowed position-independent, copy-number-dependent expression at levels similar to the AE1 transcription rate in six of six lines of transgenic mice. The mRNA from the insulated AE1/gamma-globin transgene mapped to the start site of the endogenous AE1 mRNA, and gamma-globin protein was expressed in 100% of erythrocytes in all lines. We conclude that the chicken beta-globin 5'HS4 element is necessary for full function of the AE1 promoter and that position effect variegation is associated with RNA transcription from the upstream start sites.


Figures

FIG. 1.
FIG. 1.
Transcription and steady-state levels of erythroid mRNAs in 13.5-day mouse fetal liver cells. (A) Run-on transcription assay. Fetal liver nuclei were incubated with 32P-labeled nucleosides, and the mRNA was used as a probe for a slot blot containing 5 μg of the indicated plasmid DNA, followed by autoradiography. The exposure time for the panel depicting four membrane protein gene transcripts was approximately fivefold longer than the exposure time for the panel depicting the α- and β-globin transcripts. (B) Double RNase protection assay probes containing fragments of the β-spectrin, ankyrin, and AE1 genes fused to a fragment containing exon 2 of the mouse α-globin gene. (C) RNase protection analysis of the steady-state levels of β-spectrin, ankyrin, and AE1 mRNA in 13.5-day fetal liver RNA. In each assay, 400 ng of RNA was hybridized to labeled riboprobes for α-globin (lane 1), β-spectrin/α-globin (lane 2), ankyrin/α-globin (lane 3), and AE1/α-globin (lane 4). The band sizes are 204 bp for α-globin (lanes 1, 2, and 4), 114 bp for α-globin (lane 3), 232 bp for β-spectrin (lane 2), 202 bp for ankyrin (lane 3), and 229 bp for AE1 (lane 4).
FIG. 2.
FIG. 2.
Comparison of the promoters of red cell membrane protein genes in K562 cell transient-transfection assays. The promoterless construct (top) was used to compare the activities of the indicated promoters. The 5′ ends of the promoters are indicated. The promoters were joined to the luciferase gene at positions +9 for AE1, +77 for β-spectrin, and −15 for ankyrin. The relative luciferase activities for each construct in K562 and HeLa cells are shown at the right. The data represent the mean and standard deviation from three independent experiments.
FIG. 3.
FIG. 3.
Constructs used to generate and analyze AE1 promoter activity in transgenic mice. (A) AE1/γ-globin transgenes were generated by fusing the long and short AE1 promoters to the γ-globin gene, preserving the γ-globin ATG initiation site. The 5′ ends of the AE1 promoter are indicated, and the 3′ end is +9. In the lower construct the −1738 AE1/γ-globin construct is flanked by the 1.2-kb insulator element from 5′HS4 of the chicken β-globin gene cluster. (B) Double RNase protection assay probe containing fragments of exon 2 from the human γ-globin and mouse α-globin genes. This probe protects fragments of 223 bp (γ-globin) and 204 bp (α-globin). (C) RNase protection assay probe containing a fragment of the −1738 AE1/γ-globin transgene. This probe protects a fragment of 205 bp (γ-globin exon 2) and maps exon 1 and the start sites in the AE1 promoter.
FIG. 4.
FIG. 4.
RNase protection analysis of transgene mRNA levels in reticulocytes of AE1/γ-globin transgenic mice using the γ-globin/mouse α-globin riboprobe (Fig. 3B). In each lane, 200 ng of RNA was analyzed. The bands corresponding to human γ-globin (223 bp) and mouse α-globin (204 bp) are indicated. (A) Analysis of RNA from −357 AE1/γ-globin transgenic mice. (B) Analysis of RNA from −1738 AE1/γ-globin transgenic mice. (C) Analysis of RNA from insulated −1738 AE1/γ-globin transgenic mice. The letters above the panels indicate the line of transgenic mice.
FIG. 5.
FIG. 5.
Analysis of transgene mRNA level and transgene copy number. The x axis represents the transgene copy number determined by Southern blot analysis. The y axis represents the amount of γ-globin mRNA divided by the amount of mouse α-globin mRNA in reticulocytes, as determined by RNase protection. The lines represent the best-fit correlation. (A) Analysis of −357 AE1/γ-globin transgenic mice (R2 = 0.7866; P = 0.001). (B) Analysis of −1738 AE1/γ-globin transgenic mice (R2 = 0.6014; P = 0.03). (C) Analysis of insulated −1738 AE1/γ-globin transgenic mice (R2 = 0.9829; P = 0.0001).
FIG. 6.
FIG. 6.
RNase protection analysis of transgene mRNA levels in yolk sac, fetal liver, and reticulocytes of AE1/γ-globin transgenic mice using the γ-globin/mouse α-globin riboprobe (Fig. 3B). In each lane, 200 ng of RNA was analyzed. The bands corresponding to human γ-globin (223 bp) and mouse α-globin (204 bp) are indicated. (A) Analysis of RNA from −357 AE1/γ-globin transgenic mice (line B). (B) Analysis of RNA from −1738 AE1/γ-globin transgenic mice (line G). (C) Analysis of RNA from insulated −1738 AE1/γ-globin transgenic mice (line D). Retic, reticulocyte RNA; YS, yolk sac RNA; FL, fetal liver RNA. The numbers refer to different animals in the same litter.
FIG. 7.
FIG. 7.
RNase protection analysis of transgene mRNA levels in erythroid and nonerythroid tissues of AE1/γ-globin transgenic mice using the γ-globin/mouse α-globin riboprobe (Fig. 3B). Aliquots of 200 ng of reticulocyte (Re), bone marrow (BM), and spleen (Sp) RNA and 10 μg of RNA from thymus (Ty), brain (Br), lung (Lu), heart (Ht), kidney (Ki), liver (Li), and testes (Te) were analyzed. The bands corresponding to human γ-globin (223 bp) and mouse α-globin (204 bp) are indicated. (A) Analysis of RNA from a −357 AE1/γ-globin transgenic mouse (line D). (B) Analysis of RNA from a −1738 AE1/γ-globin transgenic mouse (line B). (C) Analysis of RNA from an insulated −1738 AE1/γ-globin transgenic mouse (line C).
FIG. 8.
FIG. 8.
FACS analysis of γ-globin protein in red blood cells from AE1/γ-globin transgenic mice. Erythrocytes were stained with a FITC-conjugated monoclonal antibody against human γ-globin. The x axis represents the level of FITC detected in individual cells. The y axis represents the number of cells. The narrow lines represent analysis of erythrocytes from a negative control mouse. The heavy lines represent analysis of erythrocytes from AE1/γ-globin transgenic mice. (A) Analysis of −357 AE1/γ-globin transgenic mice. (B) Analysis of −1738 AE1/γ-globin transgenic mice. (C) Analysis of insulated −1738 AE1/γ-globin transgenic mice. The letters in the individual panels indicate the transgenic mouse line.
FIG. 9.
FIG. 9.
Mapping the transcription initiation sites in mRNA extracted from K562 cells 48 h after transfection with the AE1/γ-globin transgenes used to generate transgenic mice, using the AE1/γ-globin riboprobe (Fig. 3C). In lanes 1 to 4, 15 μg of RNA was analyzed. The bands corresponding to human γ-globin exon 2 (205 bp) from both the transgene and the endogenous γ-globin mRNA in K562 cells and endogenous γ-globin exon 1 (96 bp) are indicated by arrowheads along with the expected length of exon 1 from the AE1/γ-globin gene (105 bp). Additional bands consistent with initiation at positions −48 and −25 in the AE1/γ-globin transgene are indicated by circles. The asterisks indicate bands that are present when RNA from untransfected K562 cells is analyzed. Lane 1, analysis of RNA from untransfected K562 cells; lane 2, analysis of RNA from K562 cells transfected with −357 AE1/γ-globin; lane 3, analysis of RNA from K562 cells transfected with −1738 AE1/γ-globin, lane 4, analysis of RNA K562 cells transfected with insulated −1738 AE1/γ-globin; lane 5, size markers.
FIG. 10.
FIG. 10.
Mapping the transcription initiation sites in reticulocyte mRNA from AE1/γ-globin transgenic mice using the AE1/γ-globin riboprobe (Fig. 3C). In each lane, 400 ng of RNA was analyzed. The band corresponding to human γ-globin exon 2 (205 bp) and the expected length of AE1/γ-globin exon 1 (105 bp) are indicated by arrowheads. Circles represent bands consistent with initiation at positions −145, −48, −25, and −7 of the AE1/γ-globin gene from top to bottom, respectively. (A) Analysis of RNA from −357 AE1/γ-globin transgenic mice. (B) Analysis of RNA from −1738 AE1/γ-globin transgenic mice. (C) Analysis of RNA from insulated −1738 AE1/γ-globin transgenic mice. The length of exon 1 predicts that the major transcription initiation site is position +1 of the AE1 promoter. The letters above the panels indicate the line of transgenic mice.

References

    1. Bell, A. C., and G. Felsenfeld. 2000. Methylation of a CTCF-dependent boundary controls imprinted expression of the Igf2 gene. Nature 405:482-485. - PubMed
    1. Bell, A. C., A. G. West, and G. Felsenfeld. 1999. The protein CTCF is required for the enhancer blocking activity of vertebrate insulators. Cell 98:387-396. - PubMed
    1. Bennett, V., and P. J. Stenbuck. 1980. Association between ankyrin and the cytoplasmic domain of AE1 isolated from the human erythrocyte membrane. J. Biol. Chem. 255:6424-6432. - PubMed
    1. Benz, E. J., Jr. 1994. The erythrocyte membrane and cytoskeleton: structure, function, and disorders, p. 257-292. In G. Stamatoyannoloulos, A. W. Nienhuis, P. W. Majerus, and H. Varmus (ed.), The molecular basis of blood diseases, 2nd ed. Saunders, Philadelphia, Pa.
    1. Chung, J. H., M. Whiteley, and G. Felsenfeld. 1993. A 5′ element of the chicken beta-globin domain serves as an insulator in human erythroid cells and protects against position effect in Drosophila. Cell 74:505-514. - PubMed

Publication types

MeSH terms