. 2003 Jun 15;23(12):5149-60.
doi: 10.1523/JNEUROSCI.23-12-05149.2003.

Endogenously produced neurotrophins regulate survival and differentiation of cortical progenitors via distinct signaling pathways

Affiliations

Endogenously produced neurotrophins regulate survival and differentiation of cortical progenitors via distinct signaling pathways

Fanie Barnabé-Heider et al. J Neurosci. .

Abstract

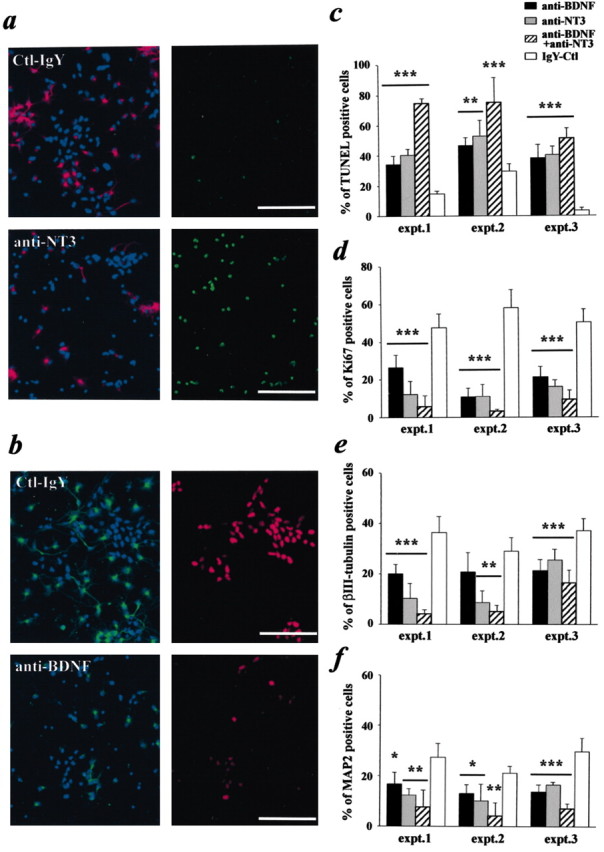
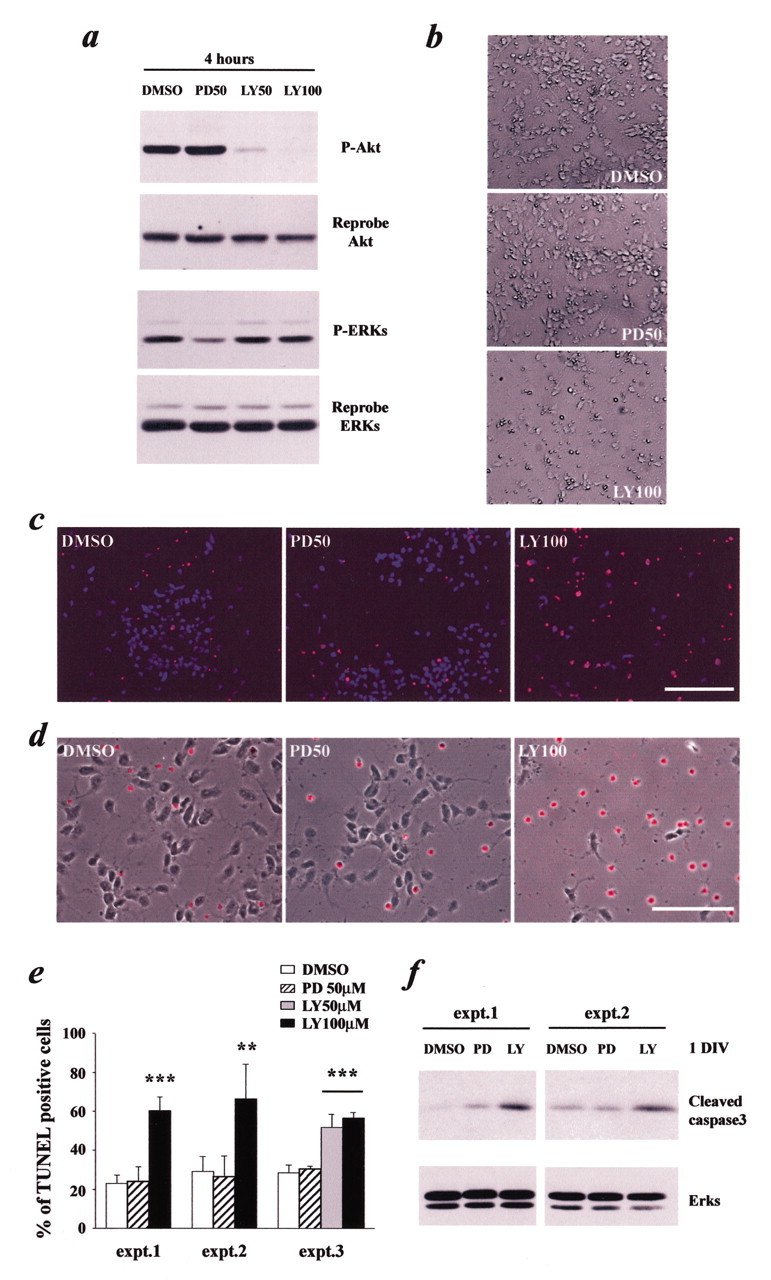
Cultured embryonic cortical progenitor cells will mimic the temporal differentiation pattern observed in vivo, producing neurons first and then glia. Here, we investigated the role of two endogenously produced growth factors, the neurotrophins brain-derived neurotrophic factor and neurotrophin-3 (NT-3), in the early progenitor-to-neuron transition. Cultured cortical progenitors express BDNF and NT-3, as well as their receptors TrkB (tyrosine kinase receptor B) and TrkC. Inhibition of these endogenously expressed neurotrophins using function-blocking antibodies resulted in a marked decrease in the survival of cortical progenitors, accompanied by decreased proliferation and inhibition of neurogenesis. Inhibition of neurotrophin function also suppressed the downstream Trk receptor signaling pathways, PI3-kinase (phosphatidyl inositol-3-kinase) and MEK-ERK (MAP kinase kinase-extracellular signal-regulated kinase), indicating the presence of autocrine-paracrine neurotrophin:Trk receptor signaling in these cells. Moreover, specific inhibition of these two Trk signaling pathways led to distinct biological effects; inhibition of PI3-kinase decreased progenitor cell survival, whereas inhibition of MEK selectively blocked the generation of neurons, with no effects on survival or proliferation. Thus, neurotrophins made by cortical progenitor cells themselves signal through the TrkB and TrkC receptors to mediate cortical progenitor cell survival and neurogenesis via two distinct downstream signaling pathways.


Figures

Figure 1.
Figure 1.
Mouse-derived cortical progenitor cells express BDNF, NT-3, TrkB, and TrkC. a, TUNEL analysis of cortical progenitors plated at decreasing cell density. Progenitors were plated at varying dilutions in the presence of FGF2 (40ng/ml) and, 2 d later, were analyzed for apoptosis. *p < 0.05; **p < 0.01; ***p < 0.001 (ANOVA). Error bars indicate SDs. b,c, RT-PCR analysis for the presence of the mRNAs (b) for the neurotrophins BDNF, NT-3, and NGF (c), for the neurotrophin receptors TrkB and TrkC in cortical progenitors (CORTICAL PROGENITOR), postmitotic cortical neurons (PM), mouse E15 brain (E15 Br), mouse adult brain (Ad Br), and cultured sympathetic neurons (SCG). GAPDH was used as a loading control in all cases. Similar results were obtained with three independent cortical progenitor cell RNA preparations (1 or 2 DIV; in the presence of 40 ng/ml FGF2). d, Immunocytochemical analysis for TrkB in cycling cortical progenitors (cultured with 40 ng/ml FGF2) and postmitotic cortical neurons. The top three panels are photographs of the same field and represent immunostaining for TrkB (left, red), the proliferation marker Ki67 (middle, green), and the merge of these two panels (right), along with a Hoechst counterstain (blue) to show all nuclei in the field (left and right). The bottom three panels are photographs of the same field and represent immunostaining for TrkB (left, red), the late neuronal marker MAP2 (middle, green), and the merge of these two panels (right), along with Hoechst (blue, left and right). Scale bar, 50 μm. e, Western blot analysis for TrkB and TrkC. Cortical progenitors (CORTICAL PROGENITOR) cultured for 4hr with 40 ng/ml FGF2 or postmitotic cortical neurons (PM) were harvested and immunoprecipitated with an antibody that recognizes all full-length members of the Trk family (IP:Pan-Trk), and then the immunoprecipitates were analyzed by Western blot analysis for TrkB (left) or TrkC (right). Arrow indicates the immunoreactive Trk receptor bands, and size markers are indicated on the right.
Figure 2.
Figure 2.
Cortical progenitors are responsive to exogenous and endogenous neurotrophins. a, Left, Cortical progenitors cultured for 2 d (CORTICAL PROGENITOR) with 40 ng/ml FGF2, postmitotic cortical neurons (PM) were washed and then stimulated for 10 min with one of the four neurotrophins, NGF, BDNF, NT-3 or NT-4 and immunoprecipitated with an antibody to all Trk receptors (IP: Pan-Trk), and the immunoprecipitates were then analyzed by Western blot analysis with an antibody to phosphotyrosine (Probe: P-Tyr). The arrow indicates the phosphotyrosine-positive band migrating at the size of the Trk receptors. BDNF, NT-3, and NT-4, but not NGF, induce Trk tyrosine phosphorylation. Right, Cortical progenitors (CORTICAL PROGENITOR; 2 DIV) cultured with FGF2 (40 ng/ml) and postmitotic cortical neurons (PM) were analyzed for endogenous Trk receptor activation, as described above, without washing or exogenous neurotrophin stimulation. b, Cortical progenitor cells, cultured for 4 hr (without FGF2), were acutely stimulated with NGF, BDNF, NT-3, or FGF2 and analyzed by Western blot for the activation of Akt and ERKs, using phosphorylation-specific Akt (P-Akt) and ERK (P-ERK) antibodies. The same blots were then reprobed for total Akt and ERK protein as a loading control. BDNF, NT-3, and FGF2 all caused increased Akt and ERK phosphorylation, relative to cells that were either unstimulated (CTL) or stimulated with NGF. c, Western blot analysis for Akt and ERK activation in cortical progenitors cultured for 18 hr in the presence of FGF2 (40 ng/ml) and antibodies specific for BDNF (anti-BDNF; 20 μg/ml), NT-3 (anti-NT-3; 20 μg/ml), or control anti-chicken IgY (Ctl-IgY; 40 μg/ml). Western blots were first probed for the activated, phosphorylated forms of Akt and the ERKs (P-Akt and P-ERKs) and then reprobed for total Akt and ERK protein as a control for equal amounts of protein.
Figure 3.
Figure 3.
Inhibition of endogenous neurotrophins decreases cortical progenitor cell survival, proliferation, and differentiation into neurons. Cortical progenitor cells cultured in the presence of FGF2 (40 ng/ml) were treated for 2d with control IgY (40 μg/ml), anti-NT-3 (20 μg/ml), anti-BDNF (20 μg/ml), or the combination of anti-NT-3 and anti-BDNF (20 μg/ml each). a, Double-label immunocytochemistry for the neuronal marker MAP2 (left, red; counterstained with Hoechst in blue) and TUNEL (right, green). Cells were treated for 2 d with either anti-NT-3 (bottom panels) or control IgY antibody (top panels). b, Double-label immunocytochemistry for βIII-tubulin (left, green; cells are counterstained with Hoechst in blue) and the Ki67 antigen, a marker for proliferating cells (right, red). Scale bars: a, b, 100 μm. c, Quantitation of three individual experiments (expt.) assessing cellular apoptosis performed as shown in a using TUNEL. d, Quantitation of three individual experiments assessing cellular proliferation performed as that shown in b using Ki67 as a marker for dividing cells. e, f, Quantitation of three individual experiments assessing neurogenesis performed as those shown in a and b using both the early neuronal marker βIII-tubulin and the later neuronal marker MAP2. In c—f, *p < 0.05; **p < 0.01; ***p < 0.001 (ANOVA). Error bars indicate SDs. Ctl, Control.
Figure 4.
Figure 4.
Cortical progenitor cell survival depends on PI3-kinase but not MEK activation. a, Western blot analysis to ascertain the efficacy and specificity of treatment with the pharmacological inhibitors PD98059 and LY294002. Progenitors were cultured in the presence of FGF2 (40 ng/ml) with DMSO (1%), PD98059 (50 μm), or LY294002 (50–100 μm) for 4 hr, and lysates were analyzed by Western blots for the active, phosphorylated form of Akt or the ERKs (P-Akt, P-ERKs). The blots were then reprobed for total Akt and ERK protein as a loading control. b—d, Analysis of apoptosis in cortical progenitors (in the presence of 40 ng/ml FGF2) treated for 2 d with DMSO, PD98059 (PD50), or LY294002 (LY100), as assessed by phase microscopy of living cells (b) or by TUNEL analysis (c, d). Cells were counterstained with Hoechst (c) or combined with the phase picture (d) to show all nuclei or cells in the field, respectively. Scale bars: c, 100 μm; d, 50 μm. e, Quantitation of three individual experiments (expt.) similar to that shown in c.**p < 0.01; ***p < 0.001 (ANOVA). Error bars indicate SDs. f, Western blot analysis for the active, cleaved form of caspase-3 in cortical progenitors cultured for 1 d in the presence of FGF2 (40 ng/ml) with DMSO, PD98059, or LY294002. Two independent experiments are shown. The blots were reprobed for total ERK protein as a loading control.
Figure 5.
Figure 5.
Cortical progenitor cell proliferation is reduced when PI3-kinase, but not MEK, is inhibited. Cortical progenitors cultured in the presence of FGF2 (40 ng/ml) were treated for 2 d with DMSO (1%), PD98059 (50 μm; PD50), or LY294002 (100 μm; LY100). a, Immunocytochemical analysis for BrdU (red), after an overnight pulse of BrdU immediately before analysis. Cells were counterstained with Hoechst (blue). b, Immunostaining for the Ki67 antigen for proliferating cells (green). Cells were counterstained with Hoechst (blue). Scale bars: a, b, 100 μm. c, Quantitation of three individual experiments (expt.) similar to that shown in b. d, Western blot analysis for two S-phase markers, cycE and cdk2, in cortical progenitors (CP) and postmitotic cortical neurons (PM). The blot was reprobed for total ERK protein as a loading control. e, Quantitation of total cell number per field, as assessed by Hoechst staining. The number of cells correspond to the average of 15 randomly captured fields per treatment per experiment. ***p < 0.001 (ANOVA). Error bars indicate SDs.
Figure 6.
Figure 6.
Differentiation of neurons but not astrocytes from cortical progenitors is dependent on MEK activation. a—e, Cortical progenitors cultured in the presence of FGF2 (40 ng/ml) were treated for 2 d with DMSO (1%), PD98059 (50 μm; PD50), or LY294002 (100 μm; LY100). a, Immunocytochemical analysis for the early panneuronal marker HuD (red). Cells were counterstained with Hoechst (blue). b, c, Immunostaining for the late panneuronal marker MAP2 (green). Cells were counterstained with Hoechst (blue) or combined with the phase picture of the field (c). Scale bars: a, b, 100 μm; c, 50 μm. d, Quantitation of four individual experiments (expt.) similar to those shown in a and b, analyzing the proportion of cells expressing HuD, MAP2, or βIII-tubulin. **p < 0.01; ***p < 0.001 (ANOVA). Error bars indicate SDs. e, Western blot analysis for the neuronal markers neuron-specific enolase (NSE) and neurofilament-medium (NFM) in cortical progenitors differentiated for 2 d (CP) and in postmitotic cortical neurons (PM) as a control. The blots were reprobed for total ERK protein as a loading control. f, Western blot analysis for the astrocyte-specific protein GFAP in cortical progenitors cultured in the presence of FGF2 (40 ng/ml) with or without CNTF (50 ng/ml) for 3 d in the presence or absence of 50 μm PD98059. Mixed cortical cultures (grown in the absence of cytosine arabinoside), which contain both neurons and astrocytes (PM-CA), were used as a positive control. The blot was reprobed for total ERK protein as a loading control.
Figure 7.
Figure 7.
Inhibition of endogenous neurotrophins, PI3-kinase, and MEK have similar effects in the absence of exogenous FGF2. a, Cortical progenitors were cultured for 2 d in the presence or absence of exogenous FGF2 (40 ng/ml), before analysis of apoptosis by TUNEL staining, proliferation by immunostaining for Ki67, or differentiation of neurons by immunocytochemistry forβIII-tubulin or MAP2. b, Cortical progenitors were treated with control IgY (40 μg/ml; IgY-Ctl), anti-NT-3 (20 μg/ml), or anti-BDNF (20 μg/ml) in the absence of exogenous FGF2 for 2 d before analysis similar to that shown in a. Graphs are representative results from one of three independent experiments. c, Cortical progenitors were treated with DMSO (1%), PD98059 (50 μm; PD), or LY294002 (50–100 μm; LY) for 2 d in the absence of exogenous FGF2 before analysis as in a. Graphs are representative results from one of three independent experiments. In all three panels, **p < 0.01; ***p < 0.001 (Student's t test in a; ANOVA in b and c). Error bars indicate SDs.

References

    1. Alcantara S, Frisen J, del Rio JA, Soriano E, Barbacid M, Silos-Santiago I ( 1997) TrkB signaling is required for postnatal survival of CNS neurons and protects hippocampal and motor neurons from axotomy-induced cell death. J Neurosci 17: 3623–3633. - PMC - PubMed
    1. Antonopoulos J, Pappas IS, Parnavelas JG ( 1997) Activation of the GABAA receptor inhibits the proliferative effects of bFGF in cortical progenitor cells. Eur J Neurosci 9: 291–298. - PubMed
    1. Benoit BO, Savarese T, Joly M, Engstrom CM, Pang L, Reilly J, Recht LD, Ross AH, Quesenberry PJ ( 2001) Neurotrophin channeling of neural progenitor cell differentiation. J Neurobiol 46: 265–280. - PubMed
    1. Brunet A, Bonni A, Zigmond MJ, Lin MZ, Juo P, Hu LS, Anderson MJ, Arden KC, Blenis J, Greenberg ME ( 1999) Akt promotes cell survival by phosphorylating and inhibiting a Forkhead transcription factor. Cell 96: 857–868. - PubMed
    1. Burrows RC, Wancio D, Levitt P, Lillien L ( 1997) Response diversity and the timing of progenitor cell maturation are regulated by developmental changes in EGFR expression in the cortex. Neuron 19: 251–267. - PubMed

Publication types

MeSH terms