

Area deprivation and widening inequalities in US mortality, 1969-1998
- PMID: 12835199
- PMCID: PMC1447923
- DOI: 10.2105/ajph.93.7.1137
Area deprivation and widening inequalities in US mortality, 1969-1998
Abstract
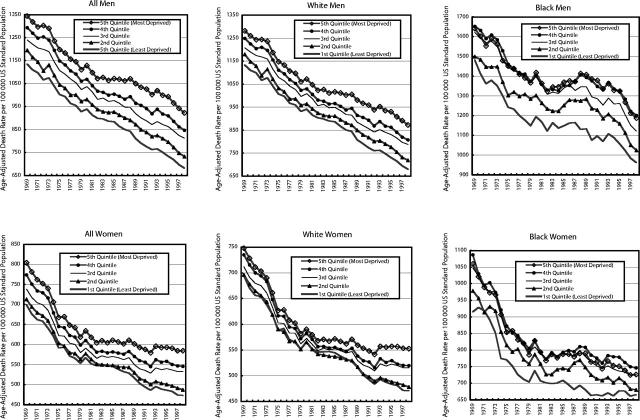
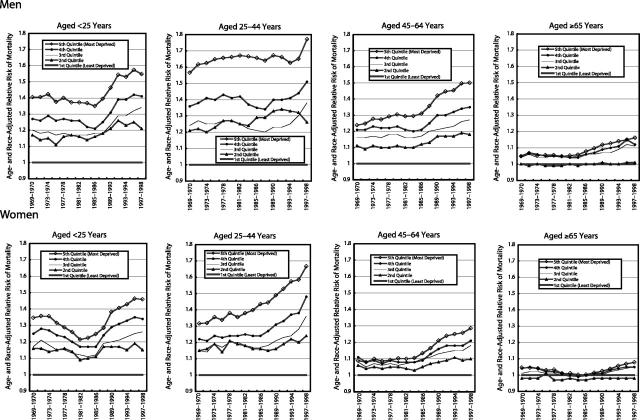
Objectives: This study examined age-, sex-, and race-specific gradients in US mortality by area deprivation between 1969 and 1998.
Methods: A census-based area deprivation index was linked to county mortality data.
Results: Area deprivation gradients in US mortality increased substantially during 1969 through 1998. The gradients were steepest for men and women aged 25 to 44 years and those younger than 25 years, with higher mortality rates observed in more deprived areas. Although area gradients were less pronounced for women in each age group, they rose sharply for women aged 25 to 44 and 45 to 64 years.
Conclusions: Areal inequalities in mortality widened because of slower mortality declines in more deprived areas. Future research needs to examine population-level social, behavioral, and medical care factors that may account for the increasing gradient.
Figures
References
-
- Pappas G, Queen S, Hadden W, Fisher G. The increasing disparity in mortality between socioeconomic groups in the United States, 1960 and 1986. N Engl J Med. 1993;329:103–109. - PubMed
-
- Feldman JJ, Makuc DM, Kleinman JC, Cornoni-Huntley J. National trends in educational differentials in mortality. Am J Epidemiol. 1989;129:919–933. - PubMed
-
- Vital Statistics of the United States, 1970–1997, Volume 2: Mortality, Parts A and B. Hyattsville, Md: National Center for Health Statistics; 1999.
-
- Murphy SL. Deaths: final data for 1998. Natl Vital Stat Rep. 2000;48(11):1–108. - PubMed
MeSH terms
LinkOut - more resources
Full Text Sources
Medical
