. 2003 Jul 7;162(1):23-35.
doi: 10.1083/jcb.200303098. Epub 2003 Jun 30.

Engineered chromosome regions with altered sequence composition demonstrate hierarchical large-scale folding within metaphase chromosomes

Affiliations

Engineered chromosome regions with altered sequence composition demonstrate hierarchical large-scale folding within metaphase chromosomes

Yuri G Strukov et al. J Cell Biol. .

Abstract

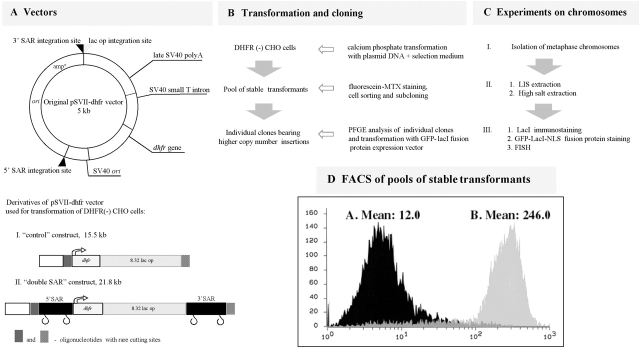
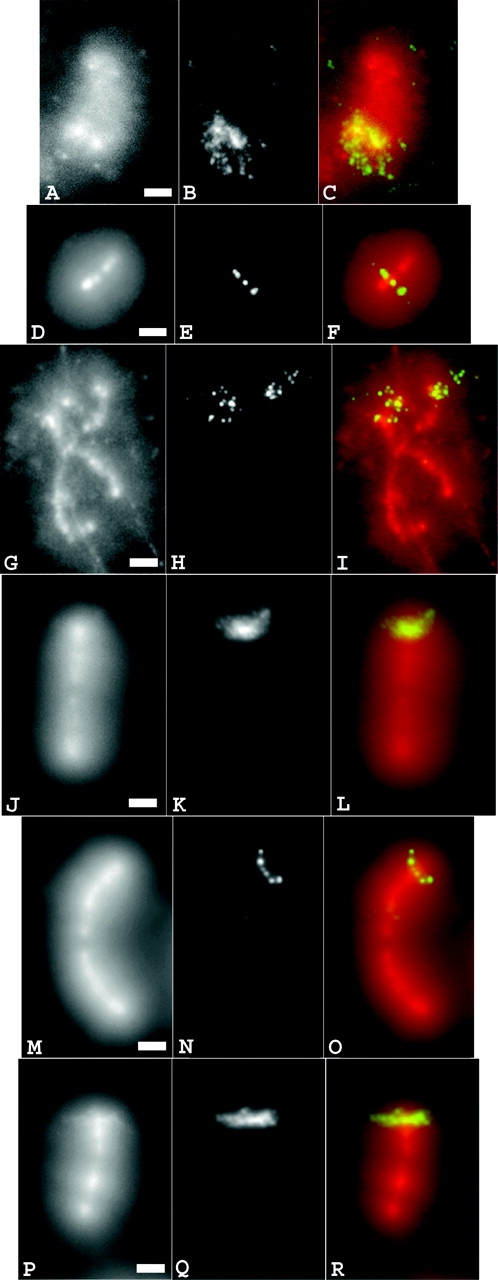
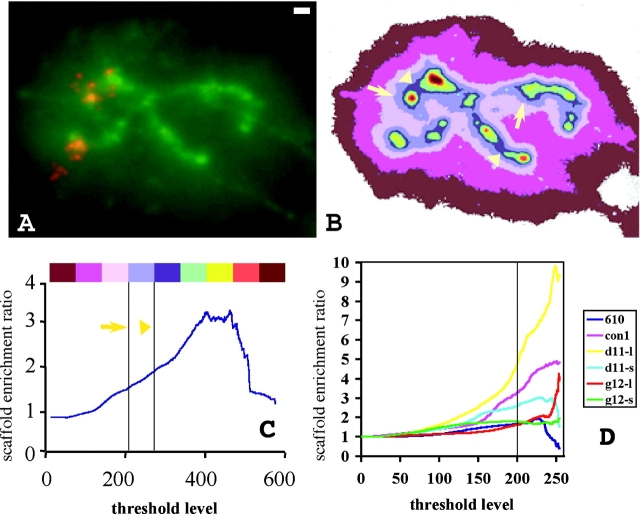
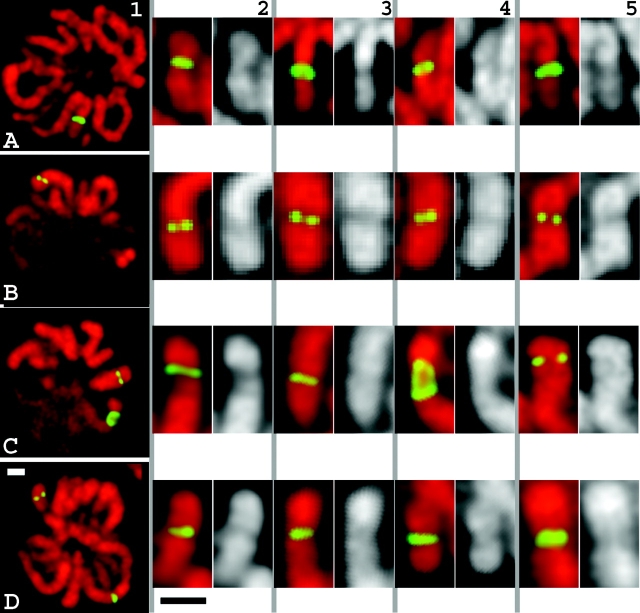
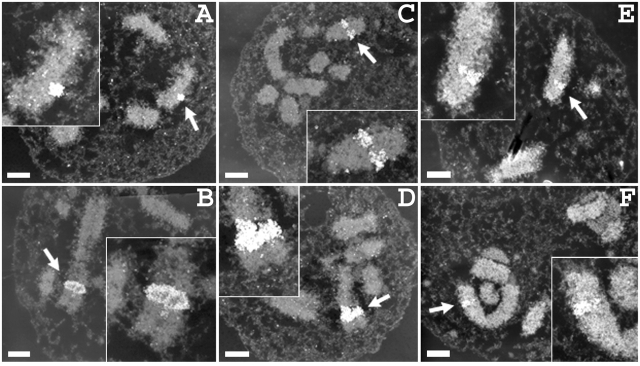
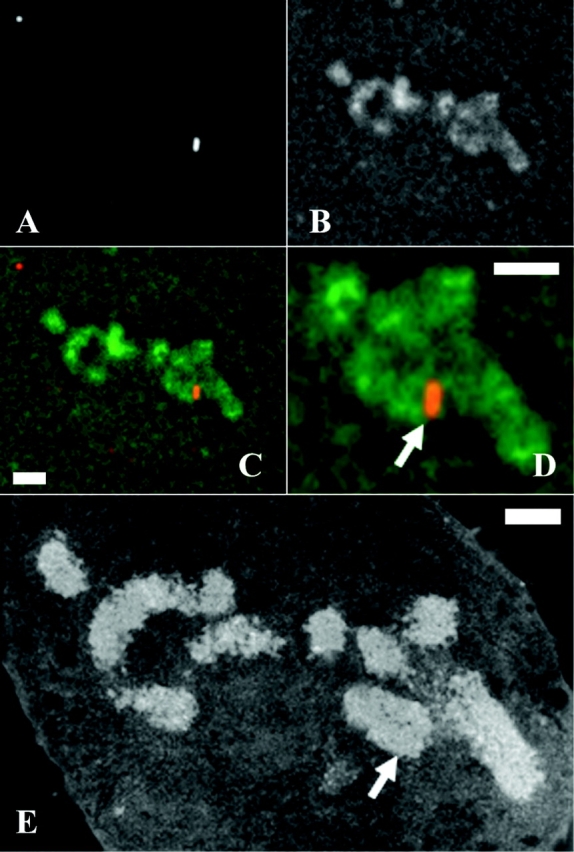
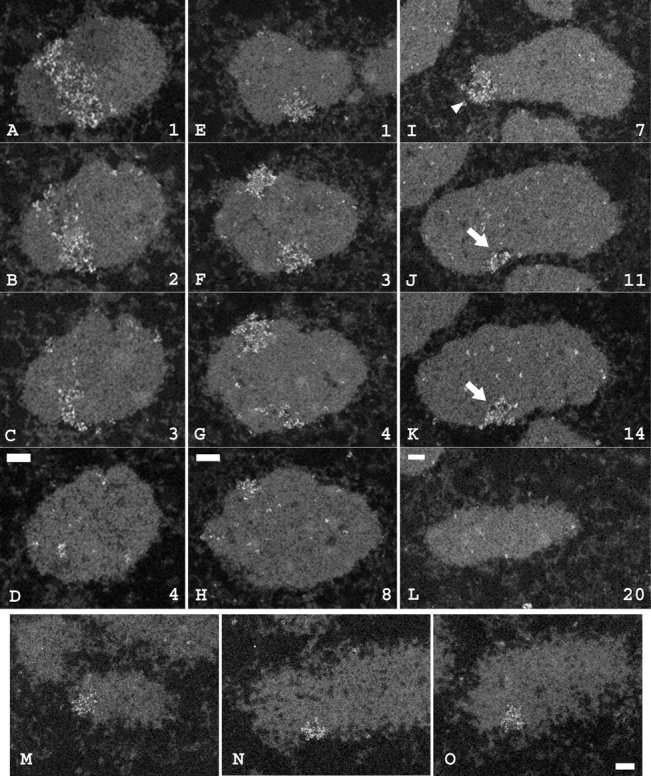
Mitotic chromosome structure and DNA sequence requirements for normal chromosomal condensation remain unknown. We engineered labeled chromosome regions with altered scaffold-associated region (SAR) sequence composition as a formal test of the radial loop and other chromosome models. Chinese hamster ovary cells were isolated containing high density insertions of a transgene containing lac operator repeats and a dihydrofolate reductase gene, with or without flanking SAR sequences. Lac repressor staining provided high resolution labeling with good preservation of chromosome ultrastructure. No evidence emerged for differential targeting of SAR sequences to a chromosome axis within native chromosomes. SAR sequences distributed uniformly throughout the native chromosome cross section and chromosome regions containing a high density of SAR transgene insertions showed normal diameter and folding. Ultrastructural analysis of two different transgene insertion sites, both spanning less than the full chromatin width, clearly contradicted predictions of simple radial loop models while providing strong support for hierarchical models of chromosome architecture. Specifically, an approximately 250-nm-diam folding subunit was visualized directly within fully condensed metaphase chromosomes. Our results contradict predictions of simple radial loop models and provide the first unambiguous demonstration of a hierarchical folding subunit above the level of the 30-nm fiber within normally condensed metaphase chromosomes.


Figures

Figure 1.
Figure 1.
Experimental approach. (A) A pSVII-dhfr vector derivative was used to create control and dSAR constructs with 32 copies of a lac operator 8-mer repeat. (B) DHFR (−) CHO cells (DG44) were stably transfected with either control or dSAR supercoiled DHFR expression vectors. fluorescein-labeled MTX–stained cells with larger inserts were selected with FACS® and cloned. (C) Mitotic chromosomes were isolated and used for extraction and staining by different methods; lac repressor immunostaining or in vivo expression of an EGFP–lac repressor–NLS fusion protein and FISH. (D) Cell flow cytometry (abscissa, logarithm of relative intensity; ordinate, cell number) after staining with fluorescein-labeled MTX. Average DHFR expression is ∼20× higher in cells transformed with the dSAR versus control vector.
Figure 2.
Figure 2.
Insert DNA is noncontiguous in clones with large inserts. Genomic DNA of clones Con-610, Con-1, dSAR-g12, and dSAR-d11 was cut with MluI, NheI, and EcoRV, endonucleases not cutting the vectors. (A) Hybridization pattern of the EcoRV digest. (B) Hybridization pattern of the MluI digest. (C) Hybridization pattern of the NheI digest. For all panels, lane M is phage λ DNA 48.5-kbp ladder.
Figure 3.
Figure 3.
Visualization of vector sequence distribution within chromosome halos. (A–C) FISH on smaller insert of clone dSAR-g12, isolated, fixed, and extracted with 2 M salt buffer. (D–F) Isolated smaller insert of dSAR-g12 extracted with LIS buffer and stained with GFP–lacI fusion protein. (G–R) Isolated chromosomes extracted with 2 M salt buffer and stained with lac repressor. (G–I) dSAR-g12, larger insert; (J–L) dSAR-d11, larger insert; (M–O) Con-610; (P-R) Con-1. (A, D, G, J, M, and P) total DNA staining (DAPI); (B) FISH signal; (C) combined DAPI and FISH signal; (E) GFP signal; (F) combined DAPI and GFP signal; (H, K, N, and Q) lac repressor immunostaining; (I, L, O, and R) combined DAPI and immunofluorescence signal. Bars, 2 μm.
Figure 4.
Figure 4.
Quantitation of scaffold association of vector sequence. Large inserts show enrichment of vector sequences over scaffold. (A) Extracted chromosome of clone dSAR-g12. Green, total DNA signal; red, vector DNA. (B) The size and shape of the scaffold depend on the threshold level. Colors are coordinated with the colored bar and threshold levels of C (arrowheads and arrows point to boundaries of two scaffolds defined by two intensity threshold levels shown in C). Higher threshold levels result in smaller scaffold regions. In C and D, the ordinate “scaffold enrichment ratio” represents the fraction of total operator signal localizing to the scaffold region divided by the fraction of total DNA localizing to the same region. Here, the scaffold region refers to the entire image region with intensity greater than the specific intensity threshold. Thus, the scaffold defined by arrows includes (but is larger than) the region defined by arrowheads. (C) Scaffold enrichment ratio versus threshold for the halo image shown in A. Intensity thresholds (vertical gray lines, marked by arrow or arrowhead) correspond to the actual scaffold regions (marked by arrows or arrowheads) shown in B. (D) Graphs represent the scaffold enrichment ratio versus threshold averaged over several halos; seven halos for Con-1 (con1), five halos for Con-610 (610), five and seven halos for smaller (d11-s) and larger (d11-l) inserts of clone dSAR-d11, respectively, and seven and four for smaller (g12-s) and larger (g12-l) inserts of clone dSAR-g12, respectively. Threshold values to the right of the vertical line correspond to defined scaffold regions that visually correspond to the DAPI core staining. Bar, 1 μm.
Figure 5.
Figure 5.
Normal chromosome morphology over insert regions by light microscopy. In native chromosomes, the vector insert appears as a band going over the entire width of the chromosome, or as a pair of spots within normal diameter chromosome. (A) Con-1 clone showing insert across entire chromosome width. (B) Con-610 clone with single insert site. (C) dSAR-d11 clone showing two insert sites. (D) dSAR-g12 clone showing two insert sites. (column 1) Lac repressor immunostaining (green) and DAPI staining (red) of metaphase cells; (columns 2–4) metaphase chromosomes at vector integration sites: lac repressor immunostaining (green), DAPI staining (red, or grayscale). (column 5) Chromosome structure at the regions of vector insertion for cells expressing GFP–lacI–NLS fusion protein. Bars, 1 μm (white, column 1; black, columns 2–5).
Figure 6.
Figure 6.
Mitotic chromosomes have normal large-scale structure at the resolution of EM. Mitotic chromosomes of all four clones showed no change in the chromosome diameter at the sites of vector insert. Arrows indicate immunogold-stained insert sites. (A) Con-610 clone. (B) Con-1 clone. (C and D) dSAR-d11 clone. C shows smaller insert, D shows larger insert. (E and F) dSAR-g12 clone. E shows the smaller insert and F shows the larger insert. Bars: 1 μm for images, 0.5 μm for inserts.
Figure 7.
Figure 7.
Normal chromosome morphology over insert regions—correlative light and electron microscopy. In native chromosomes of clone Con1, vector inserts appear as a band going over the entire width of the chromosome. Sections are 0.2 μm thick. (A–C) Fluorescent light microscopy of a single section; lac repressor immunostaining signal, staining for total DNA with DAPI, combined A and B, respectively. (D) Two-fold expanded image from C. (E) An EM image of the same section. Arrows indicate insert region labeled with immunofluorescence probes (D) and corresponding regions on EM sections (E). Bars, 1 μm.
Figure 8.
Figure 8.
A distinct,250-nm-diam coiling subunit within fully condensed metaphase chromosomes. A–D, E–H, and I–L show regions from individual serial sections from three different clone dSAR-d11 mitotic cells collected after nocodazole treatment, fixation, and immunogold labeling. Numbers represent positions of 40-nm thick sections in the original serial section stacks. Arrows and arrowhead label the two different labeled areas on the chromosome shown in I–L and displayed in three dimensions in Fig. 9, B and C. M–O show three independent examples of the small insert region from clone dSAR-g12. Bars: 0.2 μm for A–L, 0.3 μm for M–O.
Figure 9.
Figure 9.
3-D visualization of an250-nm wide subunit spanning a fraction of the chromatid width supports a hierarchical folding model. (A) Dependence of labeled band width versus insert size reveals folding subunits. In a simple radial loop model (top), as the insert size increases, the labeled region spans an increasing fraction of the chromatid cross section, with the minimal width of a labeled band corresponding roughly to the diameter of a 30-nm chromatin fiber loop. With a successive coiling model, as the insert region increases in size, the labeled region spans an increasing fraction of the chromatid cross section, but the width of this labeled region does not increase until it spans a full chromatid cross section (bottom). The width of the minimal labeled region corresponds to the diameter of the folding subunit, significantly larger than a 30-nm chromatin loop. (B) Reconstructed orthogonal cross sections of EM serial section data built with NewVision. Arrows and arrowhead show the same nanogold-labeled areas as in Fig. 8, I–L. The spot-like labeled region appears as a labeled band extending across the chromatid in the orthogonal view. Thick red, green, and blue lines in images a, b, and c are, respectively, X, Y, and Z axes of a left orthogonal system with origin inside the nanogold-labeled insert. (C) Solid model display for same chromosome region shown in Fig. 8, I–L and Fig. 9 B reveals similar appearance of labeled regions on both chromatids. In the original serial sections, one region appeared as a band (Fig. 8 I, arrowhead) and one as a spot (Fig. 8, J and K, arrows). In the orthogonal views in B and in the solid model, both regions appear as ∼250–300-nm wide segments spanning only a fraction of the chromatid cross section.

Similar articles

Cited by

References

    1. Barsoum, J. 1990. Introduction of stable high-copy-number DNA into Chinese hamster ovary cells by electroporation. DNA Cell Biol. 9:293–300. - PubMed
    1. Baumgartner, M., B. Dutrillaux, N. Lemieux, A. Lilienbaum, D. Paulin, and E. Viegas-Pequignot. 1991. Genes occupy a fixed and symmetrical position on sister chromatids. Cell. 64:761–766. - PubMed
    1. Belmont, A.S. 1997. Large-scale chromatin organization. Genome Structure and Function. C. Nicolini, editor. Kluwer Academic Publishers, Dordrecht, Netherlands. 261–276.
    1. Belmont, A.S., and K. Bruce. 1994. Visualization of G1 chromosomes: a folded, twisted, supercoiled chromonema model of interphase chromatid structure. J. Cell Biol. 127:287–302. - PMC - PubMed
    1. Belmont, A.S., M.B. Braunfeld, J.W. Sedat, and D.A. Agard. 1989. Large-scale chromatin structural domains within mitotic and interphase chromosomes in vivo and in vitro. Chromosoma. 98:129–143. - PubMed

Publication types

MeSH terms

Substances