. 2003 Jul;122(1):115-28.
doi: 10.1085/jgp.200308839.

Calcium clearance mechanisms of mouse sperm

Affiliations

Calcium clearance mechanisms of mouse sperm

Gunther Wennemuth et al. J Gen Physiol. 2003 Jul.

Erratum in

  • J Gen Physiol. 2003 Sep;122(3):375

Abstract

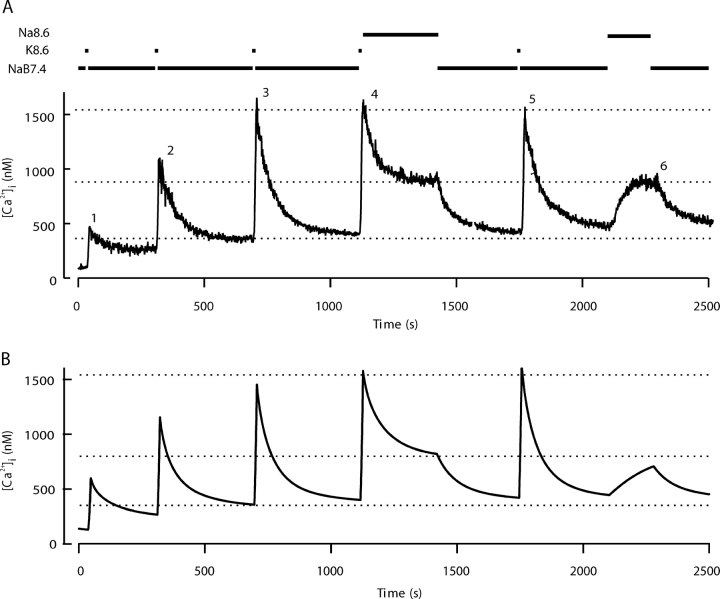
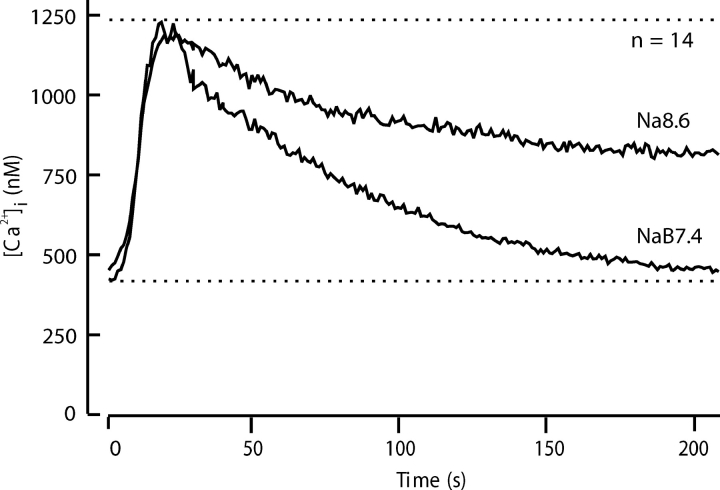
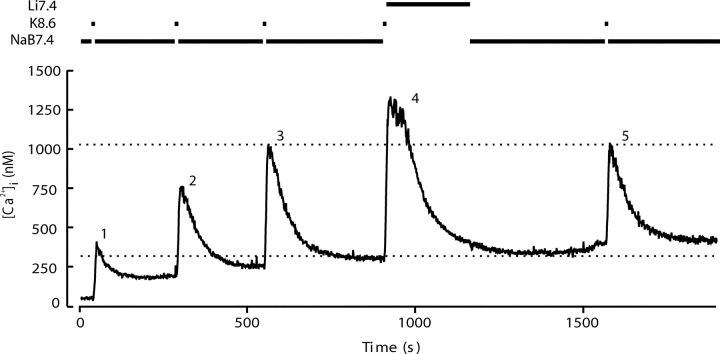
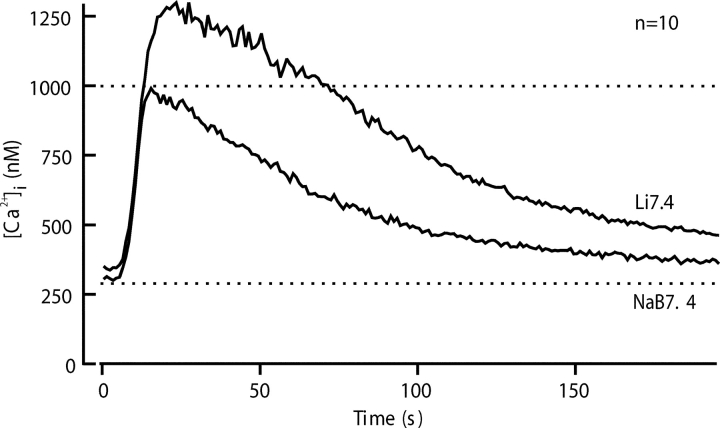
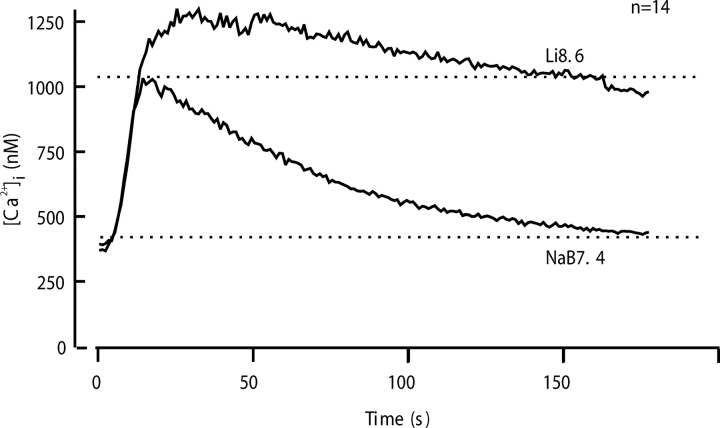
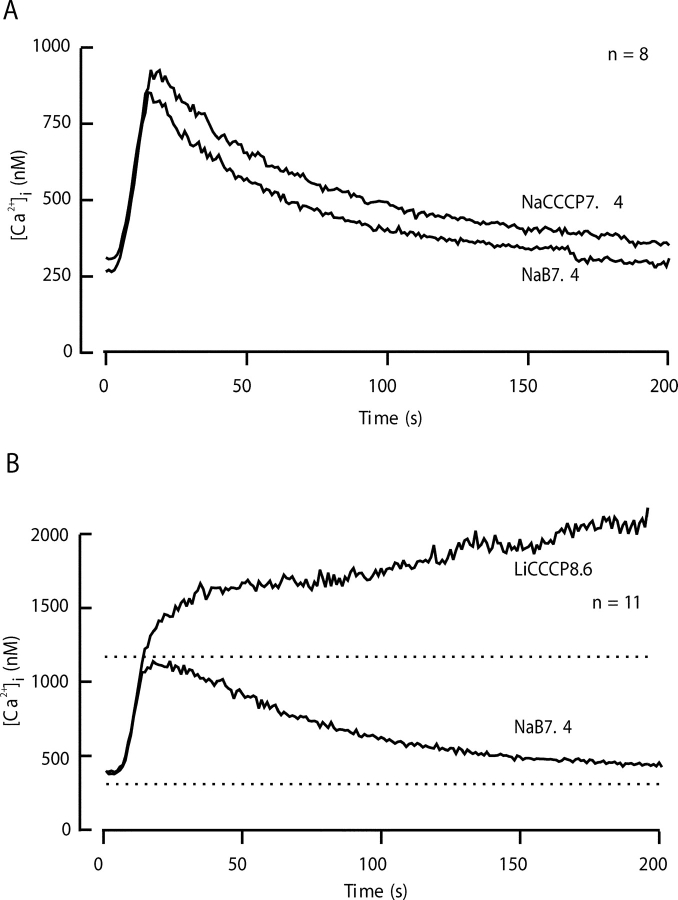
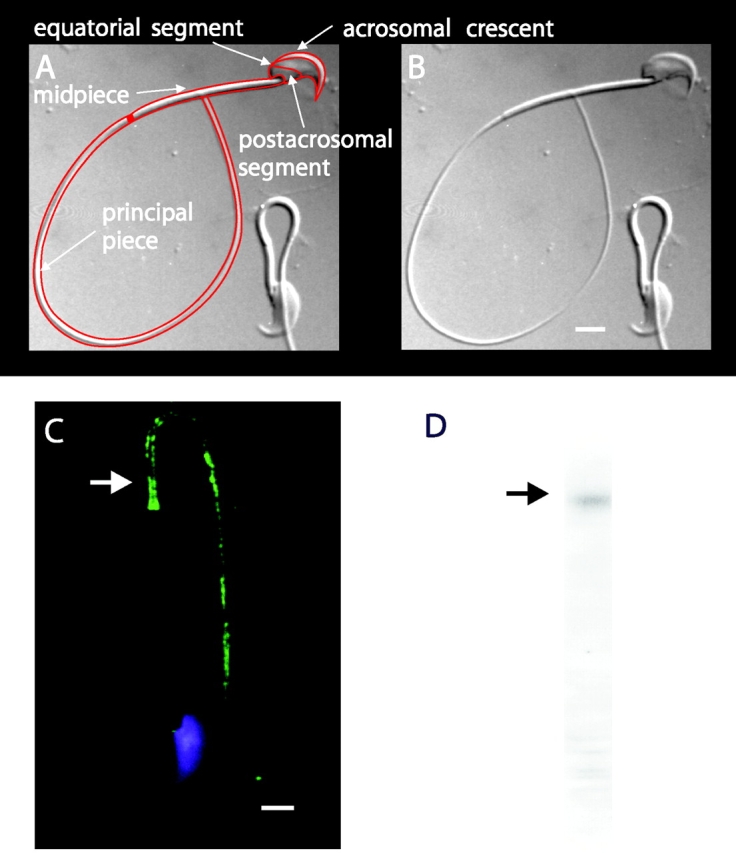
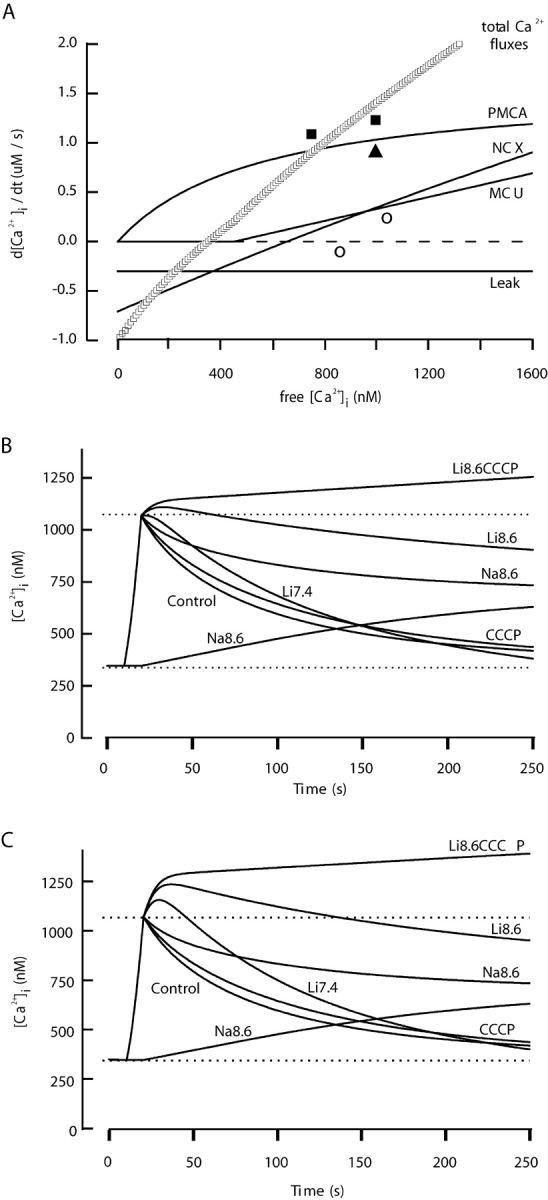
The spermatozoon is specialized for a single vital role in fertilization. Past studies show that Ca2+ signals produced by the opening of plasma membrane entry channels initiate several events required for the sperm to reach and enter the egg but reveal little about how resting [Ca2+]i is maintained or restored after elevation. We examined these homeostatic mechanisms by monitoring the kinetics of recovery from depolarizing stimuli under conditions intended to inhibit candidate mechanisms for sequestration or extrusion of Ca2+ from the cytosol. We found that the Ca2+-ATPase pump of the plasma membrane performs the major task of Ca2+ clearance. It is essential in the final stages of recovery to achieve a low resting [Ca2+]i. With immunomethods we found a approximately 130-kD plasma membrane Ca2+-ATPase protein on Western blots of whole sperm extracts and showed immunolocalization to the proximal principal piece of the flagellum. The plasma membrane Na+-Ca2+ exchanger also exports Ca2+ when [Ca2+]i is elevated. Simultaneous inhibition of both mechanisms of extrusion revealed an additional contribution to clearance from a CCCP-sensitive component, presumably sequestration by the mitochondria. Involvement of SERCA pumps was not clearly detected. Many aspects of the kinetics of Ca2+ clearance observed in the presence and absence of inhibitors were reproduced in a mathematical model based on known and assumed kinetic parameters. The model predicts that when cytosolic [Ca2+] is at 1 microM, the rates of removal by the Ca2+-ATPase, Na+-Ca2+-exchanger, mitochondrial uniporter, and SERCA pump are approximately 1.0, 0.35, 0.33, and 0 micromole l(-1) s(-1), rates substantially slower than those reported for other cells studied by similar methods. According to the model, the Na+-Ca2+ exchanger is poised so that it may run in reverse at resting [Ca2+]i levels. We conclude that the essential functions of sperm do not require the ability to recover rapidly from globally elevated cytosolic [Ca2+].


Figures

F<sc>igure</sc> 1.
Figure 1.
Calcium clearance does not require external HCO3 . Elevations of [Ca2+]i were elicited five times by 10-s depolarizations with the alkaline K+-based medium K8.6 (as marked). During recovery, cells were returned routinely to the bicarbonate-containing medium NaB7.4 to maintain strong responses to the depolarizing stimulus. But after the fourth stimulus, they were returned to medium Na7.4 that lacks HCO3 .
F<sc>igure</sc> 2.
Figure 2.
Slowing of the plasma membrane Ca2+-ATPase by elevating pHo from 7.4 to 8.6 impairs Ca2+ clearance and [Ca2+]i homeostasis. (A) Five 10-s depolarizing stimuli with K8.6 were applied as in Fig. 1. Recovery was monitored in medium NaB7.4 after stimuli 1, 2, 3, and 5, but for the fourth stimulus, the medium was changed to the alkaline solution Na8.6 during recovery. At the end of the experiment, Na8.6 was applied transiently for 170 s without a preceding depolarization in K8.6. (B) Simulations of the experiment in A using a kinetic model described in the and in Fig. 9 A. For this simulation only, two of the model parameters were adjusted. The parameter M leak in KCl was increased to 57 times M leak at rest, and the set point (rest level) for intracellular [Na+]i was progressively incremented after each KCl exposure. The initial value was 8 mM, and the subsequent values were 13.3, 16, 17.2, 17.6, and 18 mM.
F<sc>igure</sc> 3.
Figure 3.
Comparison of calcium clearance with and without slowing of the plasma membrane Ca2+ -ATPase by alkaline pHo. Recovery was monitored in 14 experiments with different cells using the five-stimulus protocol of Fig. 2. The records for the third (NaB7.4) and fourth (Na8.6) cycles of stimulus and recovery were aligned and averaged.
F<sc>igure</sc> 4.
Figure 4.
Interfering with the plasma membrane Na+-Ca2+ exchanger allows slow but complete recovery from evoked Ca2+ entry. Five depolarizing stimuli with K8.6 were applied as in Fig. 1. Recovery was monitored in medium NaB7.4 after stimuli 1, 2, 3, and 5. After the fourth stimulus, the medium was changed to Li7.4 to examine recovery in the absence of external Na+, an essential substrate for forward-mode operation of the NCX.
F<sc>igure</sc> 5.
Figure 5.
Comparison of calcium clearance with and without Na+ in the external medium to test the contribution of the Na+-Ca2+ exchanger. Recovery was monitored in 10 experiments using a five-stimulus protocol of Fig. 4. The traces for the third (NaB7.4) and fourth (Li7.4) cycles of stimulus and recovery were aligned and averaged.
F<sc>igure</sc> 6.
Figure 6.
Comparison of calcium clearance with and without simultaneous inhibition of the plasma membrane Na+-Ca2+ exchanger (NCX) and the Ca2+-ATPase pump (PMCA). Recovery was monitored in 14 experiments using a five-stimulus protocol as in Figs. 2 and 4. The traces for the third (NaB7.4) and fourth (Li8.6) cycles of stimulus and recovery were aligned and averaged.
F<sc>igure</sc> 7.
Figure 7.
Prevention of Ca2+ sequestration by mitochondria alters Ca2+ clearance only a little, but reveals a background Ca2+ leak. Recovery was monitored in two kinds of experiments using a five-stimulus protocol (as in Figs. 2 and 4) with test solutions containing 2 μM CCCP. The records for the third (Na7.4) and fourth (test) cycles of stimulus and recovery were aligned and averaged. (A) Test solution, NaCCCP7.4 (ν = 8). (B) Test solution, LiCCCP8.6 (n = 11).
F<sc>igure</sc> 8.
Figure 8.
Subcellular localization of plasma membrane Ca2+-ATPase in sperm. (A and B) DIC images of mouse sperm. In A, a line drawing overlays the image and arrows designate major anatomical features. (C) Sperm stained with the nuclear stain DAPI (blue) and anti-PMCA primary antibody (green). Immunoreactivity was found exclusively in the principal piece of the flagellum (arrow). Bars, 3 μm. (D) Western immunoblots indicate a major immunoreactive protein band migrating near that of a 140-kD marker protein (arrow).
F<sc>igure</sc> 9.
Figure 9.
Calcium clearance calculated from a kinetic model that includes rate equations for PMCA, NCX, MCU, and Ca2+ leak. The assumed resting conditions include a resting membrane potential of −43 mV and a set point for [Na+] i of 16 mM. The equations are in the . (A) Dependence of flux rates on [Ca2+]i for each transport mechanism. Calculations assume resting levels of [Na+]i, control Na7.4 extracellular medium, and a normal resting potential. Rates would be different if any of these conditions are changed. These fluxes represent the number of micromoles of Ca2+ transported per second from a liter of cell water (2.3 × 10¹³ sperm). The rate of change of free [Ca2+]i (Table I) would be given by the sum of these values (total) divided by the binding ratio for Ca2+. The symbols are values estimated in Table I from our experiments (filled squares, total flux; open triangle, PMCA flux; open circles, NCX flux). (B) Calculated time courses of intracellular free [Ca2+] before, during, and after a simulated 10-s alkaline K+ depolarization. To mimic the test conditions shown in Figs. 2–7, recovery parameters were changed as follows: the maximum velocity of the PMCA was reduced to 21% (for Na8.6), or [Na+]o was set to zero (for Li7.4), or the MCU flux was turned off (for CCCP), or combinations of these changes were used. (C) The same calculation as in part B but with the velocity of the NCX increased threefold during each period in a Na+-free, Li+ solution to mimic possible recovery from Na+-induced inactivation of the NCX.

References

    1. Adeoya-Osiguwa, S.A., and L.R. Fraser. 1996. Evidence for Ca2+-dependent ATPase activity, stimulated by decapacitation factor and calmodulin, in mouse sperm. Mol. Reprod. Dev. 44:111–120. - PubMed
    1. Arnoult, C., I.G. Kazam, P.E. Visconti, G.S. Kopf, M. Villaz, and H.M. Florman. 1999. Control of the low voltage-activated calcium channel of mouse sperm by egg ZP3 and by membrane hyperpolarization during capacitation. Proc. Natl. Acad. Sci. USA. 96:6757–6762. - PMC - PubMed
    1. Babcock, D.F., N.L. First, and H.A. Lardy. 1976. Action of ionophore A23187 at the cellular level: Separation of effects at the plasma and mitochondrial membranes. J. Biol. Chem. 251:3881–3886. - PubMed
    1. Babcock, D.F. 1983. Examination of the intracellular ionic environment and of ionophore action by null point measurements employing the fluorescein chromophore. J. Biol. Chem. 258:6380–6389. - PubMed
    1. Babcock, D.F., J. Herrington, P.C. Goodwin, Y.B. Park, and B. Hille. 1997. Mitochondrial participation in the intracellular Ca2+ network. J. Cell Biol. 136:833–844. - PMC - PubMed

Publication types