. 2003 Jul 7;198(1):111-22.
doi: 10.1084/jem.20021542. Epub 2003 Jun 30.

Presentation of exogenous antigens on major histocompatibility complex (MHC) class I and MHC class II molecules is differentially regulated during dendritic cell maturation

Affiliations

Presentation of exogenous antigens on major histocompatibility complex (MHC) class I and MHC class II molecules is differentially regulated during dendritic cell maturation

Lelia Delamarre et al. J Exp Med. .

Abstract

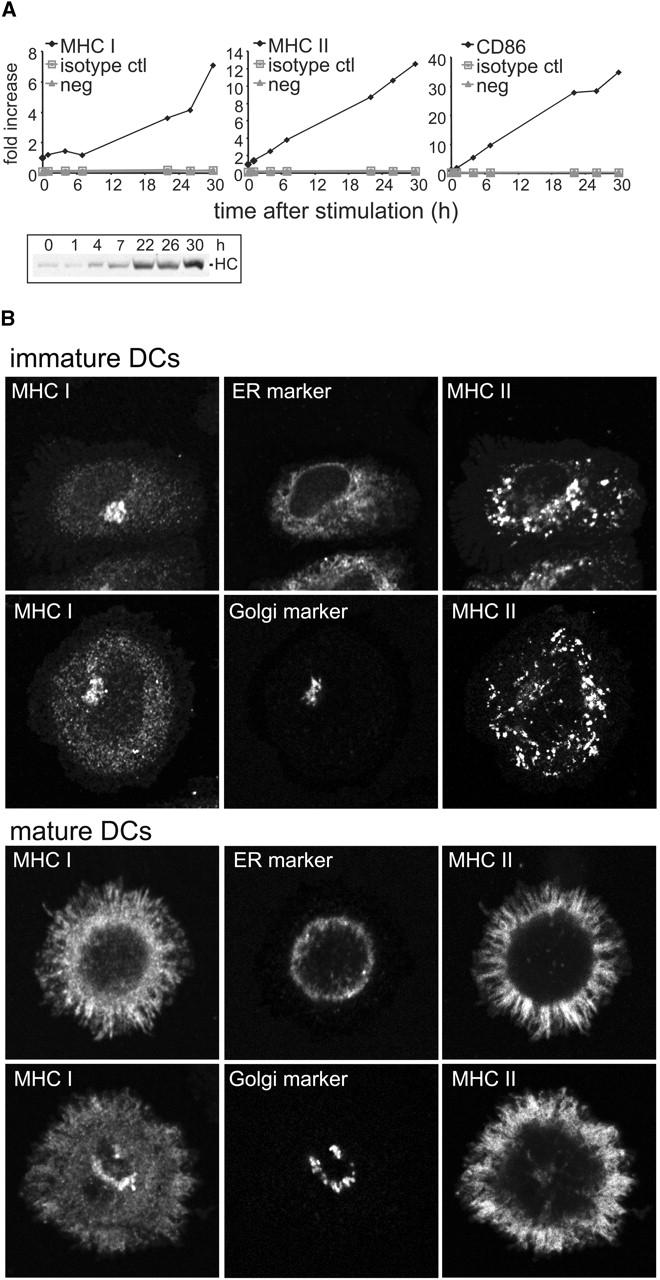
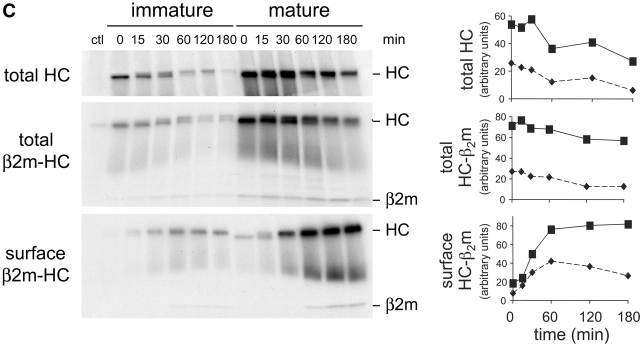
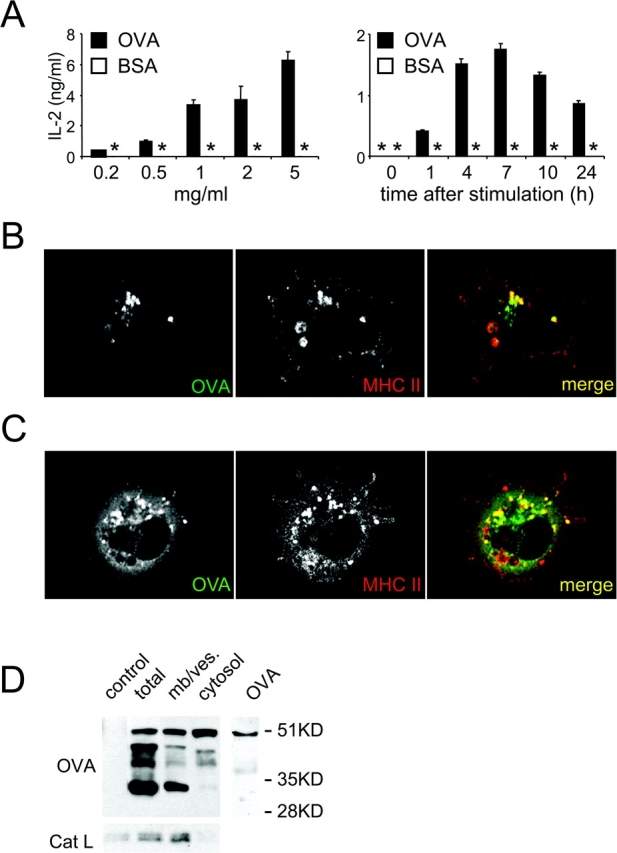
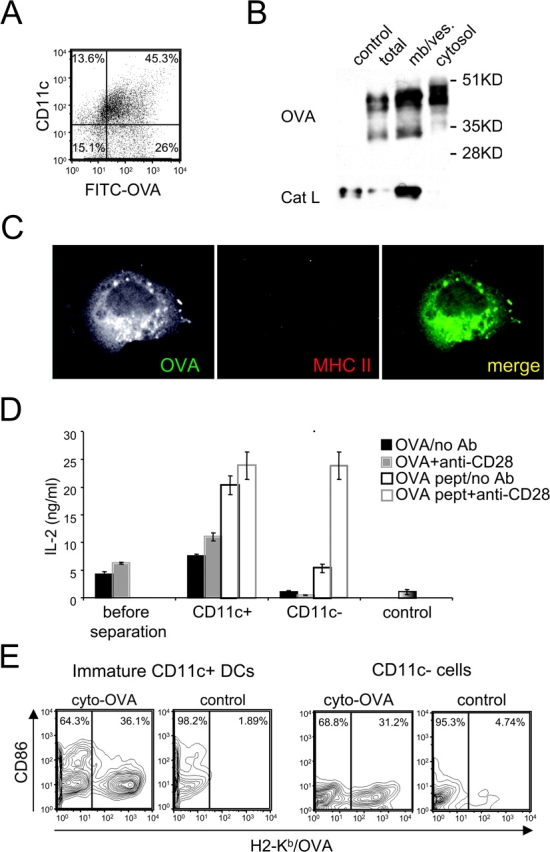
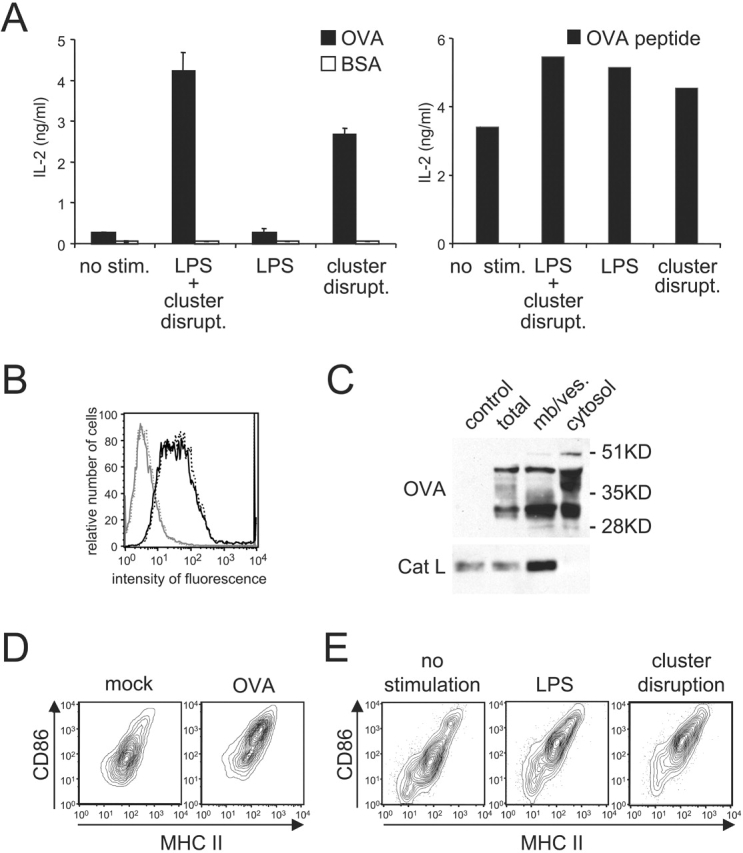
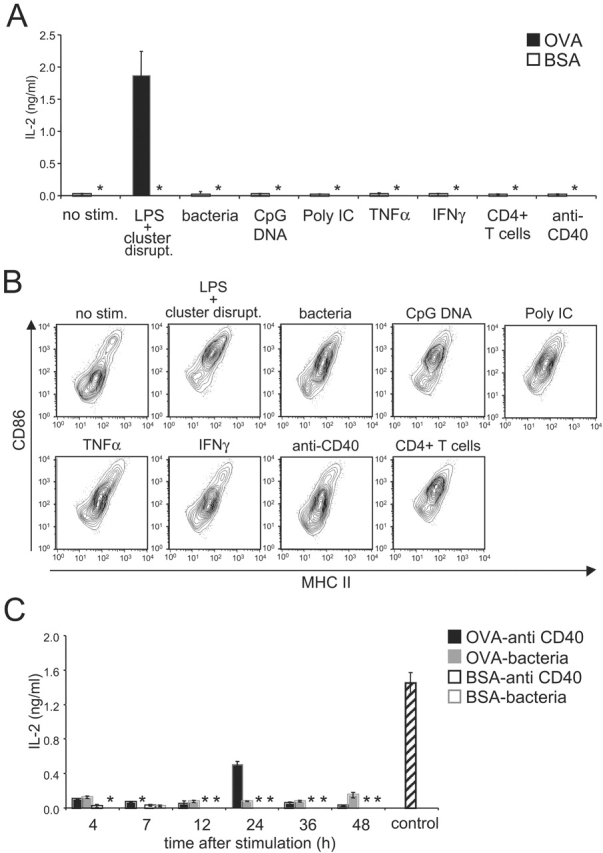
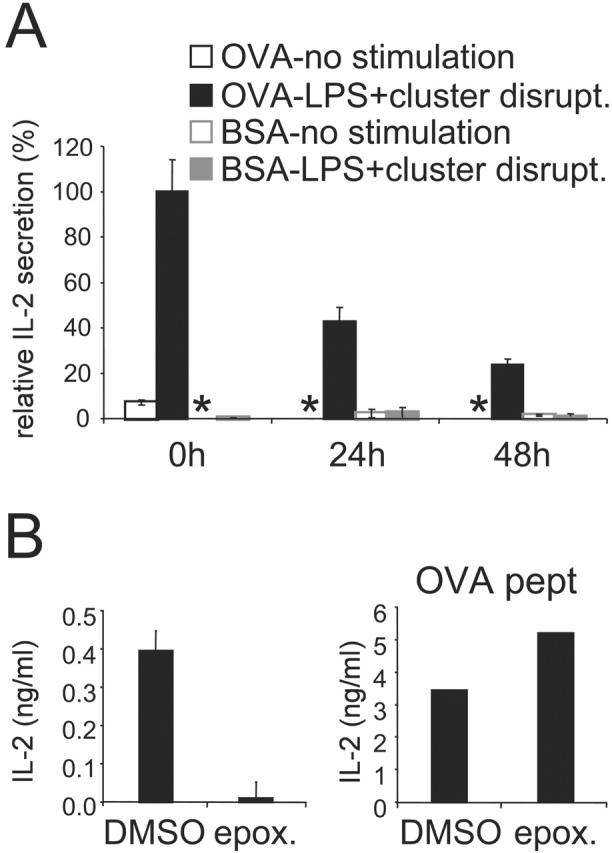
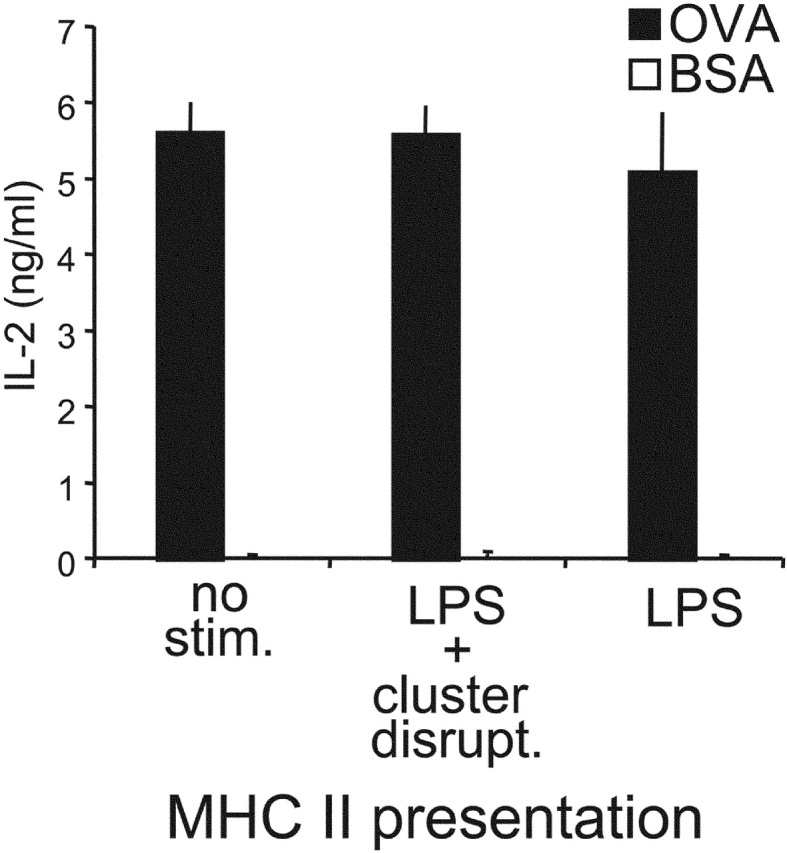
During maturation, dendritic cells (DCs) regulate their capacity to process and present major histocompatibility complex (MHC) II-restricted antigens. Here we show that presentation of exogenous antigens by MHC I is also subject to developmental control, but in a fashion strikingly distinct from MHC II. Immature mouse bone marrow-derived DCs internalize soluble ovalbumin and sequester the antigen intracellularly until they receive an appropriate signal that induces cross presentation. At that time, peptides are generated in a proteasome-dependent fashion and used to form peptide-MHC I complexes that appear at the plasma membrane. Unlike MHC II, these events do not involve a marked redistribution of preexisting MHC I molecules from intracellular compartments to the DC surface. Moreover, out of nine stimuli well known to induce the phenotypic maturation of DCs and to promote MHC II presentation, only two (CD40 ligation, disruption of cell-cell contacts) activated cross presentation on MHC I. In contrast, formation of peptide-MHC I complexes from endogenous cytosolic antigens occurs even in unstimulated, immature DCs. Thus, the MHC I and MHC II pathways of antigen presentation are differentially regulated during DC maturation.


Figures

Figure 1.
Figure 1.
MHC I surface expression is up-regulated during DC maturation. (A) Immature CD11c-positive DCs from day 4 C57BL/6J cultures were purified using magnetic beads conjugated to anti-CD11c mAb. DCs were then replated and activated by addition of LPS. At various times, cells were harvested and the cell surface expression of MHC I H-2Kb, MHC II I-Ab, and CD86 was monitored by flow cytometry. Y-axis values represent the fold increase in surface expression of the different markers. The values were obtained by dividing the median fluorescence index (MFI) at the indicated time points by the MFI at time = 0. For the controls (nonstained cells and isotype control-stained cells), the values were obtained by dividing the MFI at the indicated time points by the MFI measured with the specific Ab at time = 0. In parallel, part of the cell samples were used for monitoring the expression of total MHC I HC by Western blot. One representative experiment out of four is shown. (B) Immature and mature (activated for 24 h by addition of LPS and cluster disruption) DCs were fixed, permeabilized, and stained using P8 (anti-HC-β2M complex), TIB 120 (anti-MHC II) and either anti-KDEL (ER-resident KDEL proteins) or anti-GM130 (Golgi marker), and analyzed by confocal microscopy. (C) Immature and mature (activated for 20 h by addition of LPS and cluster disruption) CD11c-positive DCs were purified, radiolabeled with 35S-methionine/cysteine, and chased in unlabeled medium. At the indicated times, cells were subject to surface biotinylation at 0°C. The resulting lysates were split into three unequal aliquots, two of which were used for immunoprecipitation of total HC and the assembled HC-β2M complex. Cell surface MHC I was determined by NeutrAvidin pull-down of immunoprecipitated HC-β2M complexes. Autoradiograms of one experiment (of two) are shown. Data from this experiment were quantified by digital scanning and plotted graphically as arbitrary units.
Figure 1.
Figure 1.
MHC I surface expression is up-regulated during DC maturation. (A) Immature CD11c-positive DCs from day 4 C57BL/6J cultures were purified using magnetic beads conjugated to anti-CD11c mAb. DCs were then replated and activated by addition of LPS. At various times, cells were harvested and the cell surface expression of MHC I H-2Kb, MHC II I-Ab, and CD86 was monitored by flow cytometry. Y-axis values represent the fold increase in surface expression of the different markers. The values were obtained by dividing the median fluorescence index (MFI) at the indicated time points by the MFI at time = 0. For the controls (nonstained cells and isotype control-stained cells), the values were obtained by dividing the MFI at the indicated time points by the MFI measured with the specific Ab at time = 0. In parallel, part of the cell samples were used for monitoring the expression of total MHC I HC by Western blot. One representative experiment out of four is shown. (B) Immature and mature (activated for 24 h by addition of LPS and cluster disruption) DCs were fixed, permeabilized, and stained using P8 (anti-HC-β2M complex), TIB 120 (anti-MHC II) and either anti-KDEL (ER-resident KDEL proteins) or anti-GM130 (Golgi marker), and analyzed by confocal microscopy. (C) Immature and mature (activated for 20 h by addition of LPS and cluster disruption) CD11c-positive DCs were purified, radiolabeled with 35S-methionine/cysteine, and chased in unlabeled medium. At the indicated times, cells were subject to surface biotinylation at 0°C. The resulting lysates were split into three unequal aliquots, two of which were used for immunoprecipitation of total HC and the assembled HC-β2M complex. Cell surface MHC I was determined by NeutrAvidin pull-down of immunoprecipitated HC-β2M complexes. Autoradiograms of one experiment (of two) are shown. Data from this experiment were quantified by digital scanning and plotted graphically as arbitrary units.
Figure 2.
Figure 2.
Cross presentation of soluble OVA follows the classical MHC I pathway (A) Left panel: immature B6D2F1 DCs were pulsed with indicated concentrations of OVA (or BSA as a control) for 2 h, washed, activated by LPS addition and cluster disruption. After a 7 h chase, the cells were fixed and cultured with OT.1 CD8+ T cells. Right panel: after a 2 h pulse with OVA 1 mg/ml (or BSA as a control), immature DCs were washed, stimulated by LPS addition and cluster disruption, chased for the indicated times, then fixed and added to OT.1 T cells. T cell responses were monitored by measuring IL-2 secretion. (B and C) Immature DCs were pulsed with FITC-OVA (5 mg/ml) for 30 min, washed, transferred to coverslips after disrupting DC clusters and incubated at 37°C for 30 min to allow cell attachment. DCs were then fixed, permeabilized, and stained using a rabbit anti-OVA Ab, and TIB 120 (anti-MHC II), and analyzed by confocal microscopy. (D) DCs were pulsed with OVA (5mg/ml) for 30 min, washed, and chased for 30 min after stimulation by LPS addition and cluster disruption. CD11c-positive DCs were purified using magnetic beads conjugated to anti-CD11c mAb. After homogenization, cytosolic and membrane/vesicle fractions were separated by ultracentrifugation, and probed for OVA and Cat L by Western blot. One representative experiment out of three is shown.
Figure 3.
Figure 3.
CD11c-negative cells internalize and transport soluble OVA into the cytosol but do not exhibit cross presentation. (A) Immature B6D2F1 DC cultures were pulsed with FITC-OVA (5 mg/ml) for 30 min, then washed. FITC-OVA uptake and cell surface expression of CD11c were monitored by flow cytometry. (B) DC cultures were pulsed with OVA (5 mg/ml) for 30 min, washed, and chased for 30 min. CD11c-negative cells were separated from DCs using magnetic beads conjugated to anti-CD11c mAb. After homogenization of CD11c-negative cells, cytosolic and membrane/vesicle fractions were separated by ultracentrifugation, and probed for OVA and Cat L by Western blot. (C) DC cultures were pulsed with FITC-OVA (5 mg/ml) for 30 min, then washed. Cells were transferred on coverslips and incubated at 37°C for 30 min to allow their attachment. Cells were then fixed, permeabilized, and stained using a rabbit anti-OVA Ab, and TIB 120 (anti-MHC II), and analyzed by confocal microscopy. (D) DC cultures were pulsed with 1 mg/ml of OVA for 2 h, washed, activated with LPS and cluster disruption, and chased for 7 h. After fixation, CD11c-positive DCs were separated from CD11c-negative cells as in B. Mixed cultures before separation of OVA-pulsed cells (or BSA-pulsed cells as a control), CD11c-positive and CD11c-negative fractions (>95%) were then cultured with OT.1 T cells in the presence or absence of anti-CD28 mAb. T cell activation was monitored at 24 h by measuring IL-2 production. ND indicates “not done.” (E) Day 2 DC cultures were infected using a recombinant retrovirus encoding a cytoplasmic OVA construct. Cell surface expression of OVA/H2-Kb complexes (x-axis) and CD86 (y-axis) was monitored by flow cytometry on CD11c-negative and CD11c-positive cells at day 4. As a control noninfected cells were used. One representative experiment out of three is shown.
Figure 4.
Figure 4.
Cross presentation of soluble OVA is differentially regulated by DC maturation. (A) Left panel: immature B6D2F1 DCs were pulsed with OVA or BSA (1 mg/ml) for 2h in 24 well-plates where the cells were originally plated, washed carefully to avoid disruption of cell clusters (by adding media slowly along the wall of each well and then aspirating gently media at the same spot, repeatedly), and chased for 7 h with or without stimulation before fixation and culture with OT.1 T cells. Right panel: OVA-pulsed cells and T cells were cultured in the presence of OVA peptide. T cell responses were monitored at 24 h by measuring IL-2 release. (B) After the pulse-chase, MHC I H-2Kb surface expression was evaluated by flow cytometry on the CD11c-positive population of “LPS-treated and cluster disrupted” (solid black line) or unstimulated OVA-pulsed cells (dashed black line). The solid and dashed gray lines depict staining with an isotype control on stimulated and unstimulated cells, respectively. On the x-axis, the fluorescence intensity is given, whereas the y-axis depicts the relative cell number. (C) DCs were pulsed with OVA (5 mg/ml) for 30 min, washed, and chased for 30 min. CD11c-positive cells purified using magnetic beads conjugated to anti-CD11c mAb. After homogenization, cytosolic and membrane/vesicle fractions were separated, and probed for OVA and Cat L by Western blot. (D) After 7 h in culture, maturation state of “unstimulated” 2 h OVA-pulsed DCs (i.e., not treated with added LPS and not subjected to cluster disruption) and “mock-treated” DCs was examined by measuring surface expression of MHC II (x-axis) and CD86 (y-axis) by flow cytometry on the CD11c-positive population. (E) The capacity of the stimuli LPS and “cluster disruption” to trigger DC maturation was monitored on the CD11c-positive population of unpulsed cultures activated for 7 h as described above. One representative experiment out of three is shown.
Figure 5.
Figure 5.
Not all maturation stimuli induce cross presentation. (A) Immature B6D2F1 DCs were pulsed with OVA (1mg/ml) or BSA as a control for 2 h, washed, activated by addition of the indicated stimuli, and chased for 7 h before fixation and culture with OT.1 T cells. T cell responses were monitored at 24 h by measuring IL-2 release. (B) Maturation was monitored at the level of cell surface MHC II (x-axis) and CD86 (y-axis) by flow cytometry on the CD11c-positive population of unpulsed day 4 cultures activated with the indicated stimuli for 7 h. (C) The procedure was the same as described in panel A except that the DC cultures were chased for the indicated periods after stimulation with anti-CD40 Ab or bacteria. As a control, OVA-pulsed DCs stimulated for 7 h by addition of LPS and by cluster disruption were used. Results are representative of three experiments. (*) indicates below level of detection.
Figure 6.
Figure 6.
Cross presentation of OVA internalized prior DC activation. (A) Immature B6D2F1 DC were pulsed with OVA or BSA as a control (1 mg/ml) for 2 h, washed, and chased for 0 to 48 h before activation for 7 h with LPS and cluster disruption. Cells were then fixed and added to OT.1 T cells. (B) After a 24 h chase and 30 min before activation, epoxomicin 1 μM final was added to the cells and was also present during the 7 h stimulation period. As a control we used DMSO in which the drug was stocked. Cells were then fixed and added to OT.1 T cells. Right panel: OVA-pulsed cells and T cells were cultured in presence of OVA peptide. At 24 h, as marker of T cell activation IL-2 secretion was measured. One representative experiment out of three is shown, and the values represent the mean of triplicate wells. (*) indicates below level of detection.
Figure 7.
Figure 7.
Presentation of OVA by MHC I and MHC II is differentially regulated during DC maturation. Immature B6D2F1 DCs were pulsed with OVA 1mg/ml (or BSA as a control) for 2 h, washed, activated or not by addition of the indicated stimuli, and chased for 7 h before fixation and culture with CD4+ DO.11.10 T cells (specific for I-Ad/OVA). T cell responses were monitored at 24 h by measuring IL-2 release. One representative experiment out of >5 is shown.

Similar articles

Cited by

References

    1. Rock, K.L., I.A. York, T. Saric, and A.L. Goldberg. 2002. Protein degradation and the generation of MHC class I-presented peptides. Adv. Immunol. 80:1–70. - PubMed
    1. Yewdell, J.W., C.C. Norbury, and J.R. Bennink. 1999. Mechanisms of exogenous antigen presentation by MHC class I molecules in vitro and in vivo: implications for generating CD8+ T cell responses to infectious agents, tumors, transplants, and vaccines. Adv. Immunol. 73:1–77. - PubMed
    1. Sigal, L.J., S. Crotty, R. Andino, and K.L. Rock. 1999. Cytotoxic T-cell immunity to virus-infected non-haematopoietic cells requires presentation of exogenous antigen. Nature. 398:77–80. - PubMed
    1. Banchereau, J., and R.M. Steinman. 1998. Dendritic cells and the control of immunity. Nature. 392:245–252. - PubMed
    1. Norbury, C.C., B.J. Chambers, A.R. Prescott, H.G. Ljunggren, and C. Watts. 1997. Constitutive macropinocytosis allows TAP-dependent major histocompatibility complex class I presentation of exogenous soluble antigen by bone marrow-derived dendritic cells. Eur. J. Immunol. 27:280–288. - PubMed

Publication types