. 2003 Jul 7;198(1):79-89.
doi: 10.1084/jem.20021548. Epub 2003 Jun 30.

Stat5 synergizes with T cell receptor/antigen stimulation in the development of lymphoblastic lymphoma

Affiliations

Stat5 synergizes with T cell receptor/antigen stimulation in the development of lymphoblastic lymphoma

John A Kelly et al. J Exp Med. .

Abstract

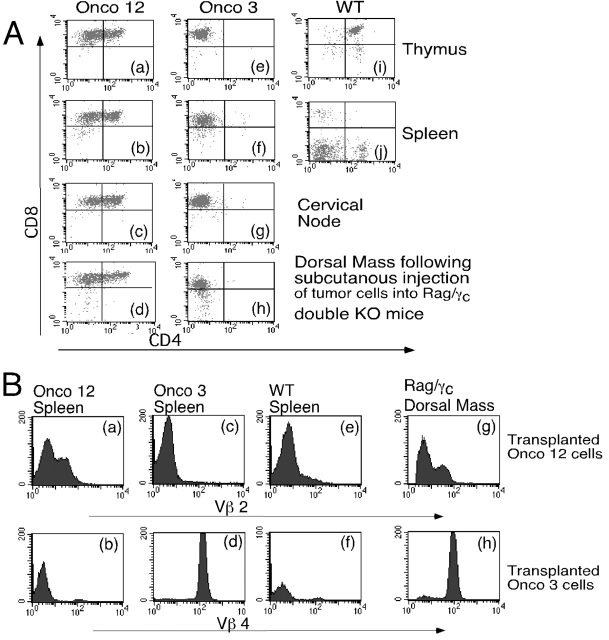
Signal transducer and activator of transcription (STAT) proteins are latent transcription factors that mediate a wide range of actions induced by cytokines, interferons, and growth factors. We now report the development of thymic T cell lymphoblastic lymphomas in transgenic mice in which Stat5a or Stat5b is overexpressed within the lymphoid compartment. The rate of lymphoma induction was markedly enhanced by immunization or by the introduction of TCR transgenes. Remarkably, the Stat5 transgene potently induced development of CD8+ T cells, even in mice expressing a class II-restricted TCR transgene, with resulting CD8+ T cell lymphomas. These data demonstrate the oncogenic potential of dysregulated expression of a STAT protein that is not constitutively activated, and that TCR stimulation can contribute to this process.


Figures

Figure 1.
Figure 1.
Anti-HA Western blotting of splenic and thymic lysates from two Stat5b transgenic lines (TG1 and TG2) and one Stat5a line (TGA). WT lysates are included as controls.
Figure 2.
Figure 2.
Lymphoblastic lymphoma in a representative Stat5b transgenic mouse. Prominent cervical adenopathy (A and B) and splenomegaly (C) were evident. (D and E) A representative cervical lymph node with round nuclei with stippled chromatin, prominent nucleoli, and frequent mitotic figures.
Figure 3.
Figure 3.
Analysis of lymphoblastic lymphoma cells from Stat5 transgenic mice. (A) Augmented CD4+/CD8+ and/or CD8+ T cells in Stat5b transgenic mice. Flow cytometric analysis of cells from thymus (panels a, e, and i), spleen (panels b, f, and j), and cervical lymph node (panels c and g). Also shown is the CD4/CD8 profile of subcutaneous cervical lesions in a RAG/γc double KO mouse 3 wk after subcutaneous injection of fresh tumor cells (panels d and h). (B) Vβ2-FITC and Vβ4-PE staining in two representative tumors demonstrating a single population of positively staining cells. Although Onco 12 had a substantial Vβ2-negative population, staining for Vβ3–6, 8, 10, 11, and Vα11 was negative. Tumor masses resulting from the injection of lymphoma cells into RAG/γc double KO mice maintained the same expression profile as the donor cells (panels g vs. a and h vs. d). (C) No constitutive phosphorylation of Stat5a or Stat5b, as evaluated by anti-phospho-Stat5 Western blotting, is seen in the tumor lysates (lanes 4–7), whereas the positive control (Stat5b transgenic splenocytes stimulated with IL-2 for 30 min) confirmed the function of the anti-phosphoStat5 antibody (lane 11). (D) No constitutive phosphorylation of Stat3 was detected by anti-phospho-Stat3 Western blotting in tumor lysates (lanes 2–5), whereas the positive control (tumor lysates stimulated with IL-6 for 30 min) confirmed the function of the anti-phospho-Stat3 antibody (lane 7). (E) EMSAs using a β-casein probe and the indicated samples. Cells from WT (lanes 1–3, 8, 9, 15, 16, 21, 22), transgenic (TG; lanes 10, 11), or mice with tumors (Onco; lanes 4–7, 12–14, 17–20) were not stimulated or stimulated with IL-2 or IL-7, and DNA binding activity measured. Supershifting with anti-Stat5 or Stat5b is shown in lanes 19 and 20, respectively.
Figure 3.
Figure 3.
Analysis of lymphoblastic lymphoma cells from Stat5 transgenic mice. (A) Augmented CD4+/CD8+ and/or CD8+ T cells in Stat5b transgenic mice. Flow cytometric analysis of cells from thymus (panels a, e, and i), spleen (panels b, f, and j), and cervical lymph node (panels c and g). Also shown is the CD4/CD8 profile of subcutaneous cervical lesions in a RAG/γc double KO mouse 3 wk after subcutaneous injection of fresh tumor cells (panels d and h). (B) Vβ2-FITC and Vβ4-PE staining in two representative tumors demonstrating a single population of positively staining cells. Although Onco 12 had a substantial Vβ2-negative population, staining for Vβ3–6, 8, 10, 11, and Vα11 was negative. Tumor masses resulting from the injection of lymphoma cells into RAG/γc double KO mice maintained the same expression profile as the donor cells (panels g vs. a and h vs. d). (C) No constitutive phosphorylation of Stat5a or Stat5b, as evaluated by anti-phospho-Stat5 Western blotting, is seen in the tumor lysates (lanes 4–7), whereas the positive control (Stat5b transgenic splenocytes stimulated with IL-2 for 30 min) confirmed the function of the anti-phosphoStat5 antibody (lane 11). (D) No constitutive phosphorylation of Stat3 was detected by anti-phospho-Stat3 Western blotting in tumor lysates (lanes 2–5), whereas the positive control (tumor lysates stimulated with IL-6 for 30 min) confirmed the function of the anti-phospho-Stat3 antibody (lane 7). (E) EMSAs using a β-casein probe and the indicated samples. Cells from WT (lanes 1–3, 8, 9, 15, 16, 21, 22), transgenic (TG; lanes 10, 11), or mice with tumors (Onco; lanes 4–7, 12–14, 17–20) were not stimulated or stimulated with IL-2 or IL-7, and DNA binding activity measured. Supershifting with anti-Stat5 or Stat5b is shown in lanes 19 and 20, respectively.
Figure 4.
Figure 4.
Oligonucleotide (GeneChip®) microarray analysis indicating that the lymphomas are of thymic origin. (A) Shown is a dendogram corresponding to 4372 genes whose expression was detected in all groups (WTS, TGS, CD8WTS, CD8TGS, WTT, TGT, ONCOS, ONCOT). The “Thymic” and “Splenic” clusters refer to samples whose expression patterns were most similar to those found in normal thymus and spleen, respectively (i.e., they “coclustered”). Note that the pattern observed for CD8+ T cell enriched splenocytes was similar to that observed in total splenocytes. The mice with lymphomas are designated as in Table I. (B) A selection of genes that were similarly expressed in the lymphomas and thymic tissue. (C) Genes that were more highly expressed (>1.4-fold increased) in lymphomas than in any of the WT or TG tissue samples. Green squares correspond to genes with relatively low level of expression and red squares to genes with relatively high level of expression (e.g., in one of the TGT samples [second from the right] fewer genes were highly expressed). The raw data and a complete list of the genes will be available at www.nhlbi.nih.gov/labs/supplements.
Figure 5.
Figure 5.
Effect of the Stat5b and TCR transgenes on CD4/CD8 flow cytometric profiles, activation state, and proliferative potential of thymocytes. (A) CD4/CD8 profiles for wild type vs. Stat5b transgenic thymocytes. CD4+/CD8+ (DP) thymocytes (day 0) were cultured with PMA + ionomycin for 24 h (day 1) followed by 48 h in RPMI (day 3 cells; reference 19). Similar results were obtained if anti-TCRβ (H57–597) + anti-CD2 (RM2–5) was used instead of PMA + ionomycin. (B) CD44/IL-2Rα profiles (gated on total population) for the same cells as in A. (C) Stat5b transgenic thymocytes exhibit augmented proliferation to IL-7, to anti-CD3 + anti-CD28, or to both stimuli.
Figure 6.
Figure 6.
Stat5 transgenic mice are more prone to malignant transformation in the presence of a TCR transgene. (A) Mice that were heterozygous for the Stat5b and 5CC7 TCR transgenes (b and d) exhibited an increase in activated CD8+ T cells as compared with mice only carrying the 5CC7 transgene (a and c). CD4/CD8 (a and b), CD44/IL-2Rα (gated on CD4/CD8 [DN], c and d), and Vβ3/Vα11 (e and f) profiles of mice that were heterozygous for the 5C.C7 TCR transgene and RAG2 (panels a, c, and e) and also for the Stat5b transgene (panels b, d, and f) are shown. (B) 5C.C7 TCR transgenic mice (panels a and d) and 5C.C7 TCR/Stat5b transgenic mice (panels b, c, e, and f) were immunized intraperitoneally with cytochrome c/CFA, and CD4/CD8 (panels a, b, and c) and CD44/IL-2Rα (gated on CD8+, panels d, e, and f) profiles were analyzed upon sacrifice 3 wk later. The mouse represented by panels b, e, and h had no evidence of lymphoma whereas the mouse represented by panels c, f, and i had an enlarged thymus consistent with lymphoblastic lymphoma. In A and B, total thymocyte numbers are shown in parentheses on the far right. (C) Age of diagnosis of lymphomas. Shown are Stat5b transgenic mice, not immunized or immunized with ovalbumin/CFA, and Stat5b/5C.C7 double transgenic mice that were either not immunized or immunized with cytochrome c/CFA. Each point represents a single mouse, and the median for each group is indicated by the horizontal bar. (D) Proliferation of thymocytes from mice that were heterozygous for both the Stat5b and 5CC7 TCR transgenes, with and without lymphoma, after incubation with cytochrome c (200 μg/ml) or 1 nM IL-7 for 72 h.
Figure 7.
Figure 7.
Time-course analysis of Stat5b/5C.C7 and 5C.C7 mice. (A) CD8+ thymocyte numbers increase over time in Stat5b/5C.C7 double transgenic mice. Each point represents a single mouse. (B) CD4/CD8 profile of Stat5b/5C.C7 and 5C.C7 transgenic mice over time. Representative profiles are shown for the time points indicated (with total cellularity indicated above in parentheses). The 5C.C7 single transgenic mice either have significant loss of thymocytes over time (panels c and d) or an expansion of CD4+ cells with time (panels i and j), whereas the Stat5b/5C.C7 double transgenic mice have an expansion of CD8+ cells. (C) Anti-CD3 induced proliferation of total thymocytes. Each point represents a single mouse. (D) Shown is a dendogram resulting from unsupervised clustering of 6250 genes that were expressed “present” in any group. (E) Expression of genes that were found to be more highly expressed in Stat5b transgenic mice with lymphoma (see Fig. 4 C and online supplemental material), were also analyzed over time in 5C.C7 and in Stat5b/5C.C7 mice. In A and C, the 12-wk-old group includes all mice 12–13 wk old.

Similar articles

Cited by

References

    1. Stark, G.R., I.M. Kerr, B.R. Williams, R.H. Silverman, and R.D. Schreiber. 1998. How cells respond to interferons. Annu. Rev. Biochem. 67:227–264. - PubMed
    1. Leonard, W.J., and J.J. O'Shea. 1998. Jaks and STATs: biological implications. Annu. Rev. Immunol. 16:293–322. - PubMed
    1. Darnell, J.E., Jr. 1997. STATs and gene regulation. Science. 277:1630–1635. - PubMed
    1. Bowman, T., R. Garcia, J. Turkson, and R. Jove. 2000. STATs in oncogenesis. Oncogene. 19:2474–2488. - PubMed
    1. Migone, T.S., J.X. Lin, A. Cereseto, J.C. Mulloy, J.J. O'Shea, G. Franchini, and W.J. Leonard. 1995. Constitutively activated Jak-STAT pathway in T cells transformed with HTLV-I. Science. 269:79–81. - PubMed