. 2003 Jul 22;100(15):8644-8.
doi: 10.1073/pnas.1431750100. Epub 2003 Jul 1.

A microscopic view of ion conduction through the K+ channel

Affiliations

A microscopic view of ion conduction through the K+ channel

Simon Bernèche et al. Proc Natl Acad Sci U S A. .

Abstract

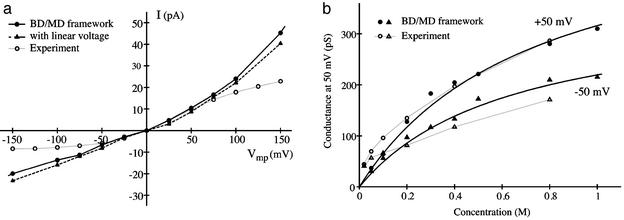
Recent results from x-ray crystallography and molecular dynamics free-energy simulations have revealed the existence of a number of specific cation-binding sites disposed along the narrow pore of the K+ channel from Streptomyces lividans (KcsA), suggesting that K+ ions might literally "hop" in single file from one binding site to the next as permeation proceeds. In support of this view, it was found that the ion configurations correspond to energy wells of similar depth and that ion translocation is opposed only by small energy barriers. Although such features of the multiion potential energy surface are certainly essential for achieving a high throughput rate, diffusional and dissipative dynamical factors must also be taken into consideration to understand how rapid conduction of K+ is possible. To elucidate the mechanism of ion conduction, we established a framework theory enabling the direct simulation of nonequilibrium fluxes by extending the results of molecular dynamics over macroscopically long times. In good accord with experimental measurements, the simulated maximum conductance of the channel at saturating concentration is on the order of 550 and 360 pS for outward and inward ions flux, respectively, with a unidirectional flux-ratio exponent of 3. Analysis of the ion-conduction process reveals a lack of equivalence between the cation-binding sites in the selectivity filter.


Figures

Fig. 1.
Fig. 1.
Transmembrane potential profile along the pore of an open-state model of the KcsA (3) generated from the structure of the calcium-activated K+ channel from M. thermoautrophicum (4). The curve is drawn assuming a positive unitary value of the intracellular potential. The potential at the position of the five most important cation-binding sites, S0–S4, is highlighted (filled dots). For comparison, the profile calculated for the closed state of KcsA is also shown (24).
Fig. 2.
Fig. 2.
The total multiion free-energy profile Wtot(Z1, Z2, Z3) including the equilibrium PMF calculated from MD and a transmembrane voltage of ±150 mV. Wtot(Z1, Z2, Z3) is obtained from Eq. 2 by using the transmembrane potential profile shown in Fig. 1. The 2D projection maps were calculated as a function of the reduced reaction coordinates (Z1+Z2)/2 and Z3 (the ions are numbered from 1 to 3 starting from the extracellular side; see ref. 5). Each color contour corresponds to 1 kcal/mol. The dominant mechanism for outward (+150 mV) (a) and inward (–150 mV) (b) ion movements are indicated with dashed arrows. The principal ionic configurations along the conduction pathways are illustrated: A, [Cavity, S3, S1]; B, [S4, S3, S1]; C, [S4, S2, S0].
Fig. 3.
Fig. 3.
Typical BD trajectory generated with an applied membrane potential of +50 mV and under symmetric conditions of K+ concentration chosen to yield a channel occupied by three ions 50% of the time. The Z(t) of the two or three ions in the system is alternatively plotted in blue, red, and green for the sake of clarity. The relative ion density along the pore is shown in relation to the different binding sites. Many outward translocation events can be observed; for example, the red curve shows some of these events between 5 and 10, 25 and 30, 35 and 45, and 90 and 95 ns. A reentry of a translocating ion in the direction opposite to the transmembrane potential can be observed between 45 and 68 ns. Binding of an ion from the extracellular solution briefly to site S0 stabilizes ions in sites S2 and S4 (e.g., around 48 ns).
Fig. 4.
Fig. 4.
(a) IV relation calculated from BD simulations under symmetric conditions and K+ concentration of 400 mM. (b) Conductance of the KcsA at ±50 mV as a function of permeant ion concentration. The variation of the channel conductance as a function of K+ concentration follows a first-order saturation with KD values of 740 and 640 mM for +50 and –50 mV, respectively. Experimental data from ref. (open symbols and gray lines) were taken from www.jgp.org/cgi/content/full/118/3/303/DC1/1.

References

    1. Hille, B. (2001) Ionic Channels of Excitable Membranes (Sinauer, Sunderland, MA), 3rd Ed.
    1. Zhou, Y., Morais-Cabral, J. H., Kaufman, A. & MacKinnon, R. (2001) Nature 414, 43–48. - PubMed
    1. Doyle, D. A., Cabral, J. M., Pfuetzner, R. A., Kuo, A., Gulbis, J. M., Cohen, S. L., Chait, B. T. & MacKinnon, R. (1998) Science 280, 69–77. - PubMed
    1. Jiang, Y., Lee, A., Chen, J., Cadene, M., Chait, B. T. & MacKinnon, R. (2002) Nature 417, 515–522. - PubMed
    1. Bernèche, S. & Roux, B. (2001) Nature 414, 73–77. - PubMed

Publication types