. 2003 Jul;15(7):1524-37.
doi: 10.1105/tpc.011742.

Sexual and apomictic reproduction in Hieracium subgenus pilosella are closely interrelated developmental pathways

Affiliations

Sexual and apomictic reproduction in Hieracium subgenus pilosella are closely interrelated developmental pathways

Matthew R Tucker et al. Plant Cell. 2003 Jul.

Abstract

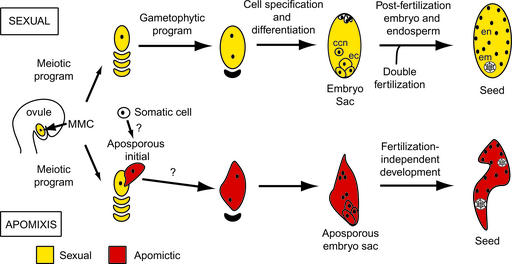
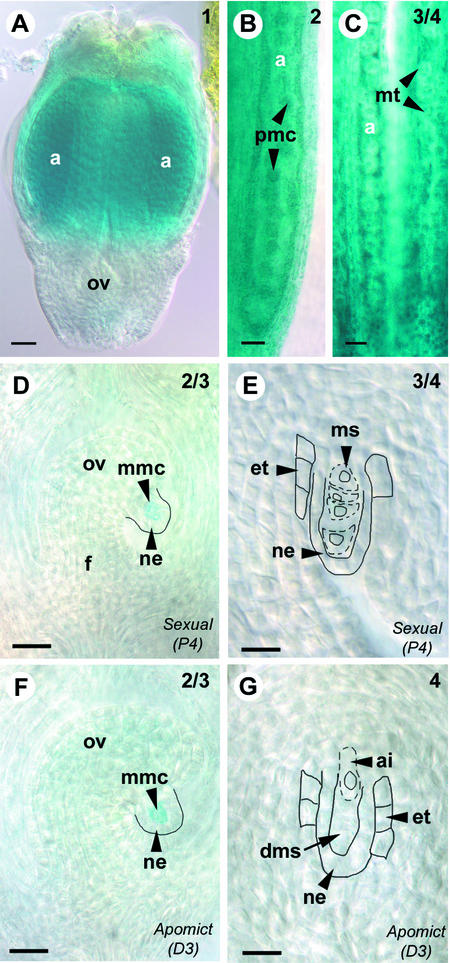
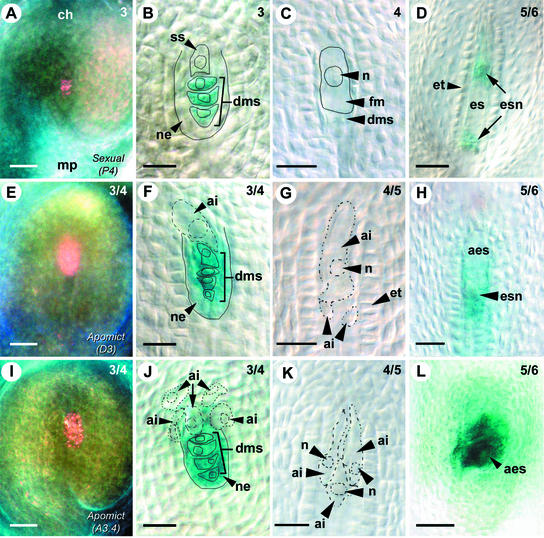
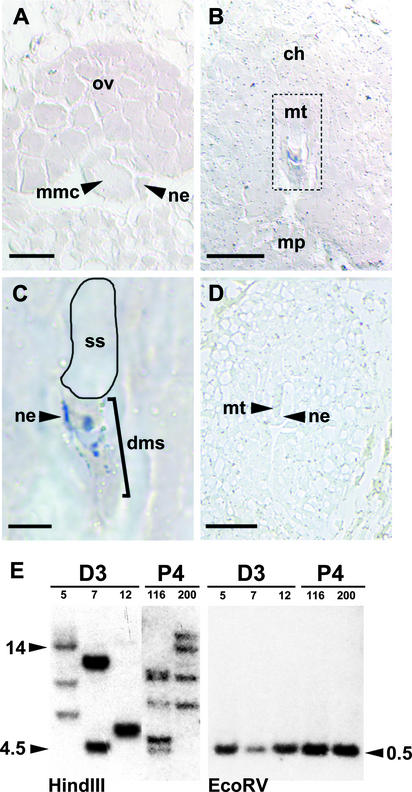
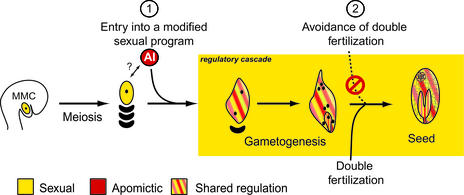
Seed formation in flowering plants requires meiosis of the megaspore mother cell (MMC) inside the ovule, selection of a megaspore that undergoes mitosis to form an embryo sac, and double fertilization to initiate embryo and endosperm formation. During apomixis, or asexual seed formation, in Hieracium ovules, a somatic aposporous initial (AI) cell divides to form a structurally variable aposporous embryo sac and embryo. This entire process, including endosperm development, is fertilization independent. Introduction of reproductive tissue marker genes into sexual and apomictic Hieracium showed that AI cells do not express a MMC marker. Spatial and temporal gene expression patterns of other introduced genes were conserved commencing with the first nuclear division of the AI cell in apomicts and the mitotic initiation of embryo sac formation in sexual plants. Conservation in expression patterns also occurred during embryo and endosperm development, indicating that sexuality and apomixis are interrelated pathways that share regulatory components. The induction of a modified sexual reproduction program in AI cells may enable the manifestation of apomixis in HIERACIUM:


Figures

Figure 1.
Figure 1.
Mechanisms of Sexual and Apomictic Reproduction in Hieracium. ccn, central cell nucleus; ec, egg cell; em, embryo; en, endosperm.
Figure 2.
Figure 2.
AtFIS2:GUS and AtFIE:GUS Expression during Early Seed Development. Ovules from Arabidopsis Landsberg erecta AtFIS2:GUS ([A] to [C]), sexual Hieracium P4 ([D] to [F], [N], and [O]), and apomictic Hieracium D3 and A3.4 ([G] to [M]) were stained with GUS and viewed whole-mount using Nomarski differential interference contrast (DIC) microscopy. (A) to (M) show AtFIS2:GUS expression, and (N) and (O) show AtFIE:GUS expression. Bars = 50 μm. (A) Anthesis ovule containing unfused polar nuclei (upn) within the mature embryo sac. (B) Postfertilization ovule containing dividing endosperm nuclei (en). (C) Postfertilization ovule after the sixth mitotic division of endosperm development, with GUS staining in the endosperm cyst (c). (D) Mature embryo sac in the chalazal (ch)-to-micropylar (mp) orientation surrounded by the endothelium (et), containing a fused polar nucleus (pn) and egg cell (ec). (E) Postfertilization embryo sac containing dividing endosperm nuclei and a dividing proembryo (pe). (F) Developing fertilized seed containing an early-heart-stage embryo (em) and cellular endosperm (cen). (G) Mature aposporous D3 embryo sac (aes) containing central cell–like nuclei (n). (H) Aposporous D3 embryo sac showing dividing autonomous endosperm nuclei (aen) and two globular embryos. (I) Developing D3 seed showing a heart-stage embryo and autonomous cellular endosperm. (J) Multiple aposporous embryo sac structures developing within a single A3.4 ovule. (K) Displaced aposporous embryo sac developing in the chalazal region of a D3 ovule. (L) Developing A3.4 seed containing autonomous endosperm and showing parthenogenetic embryo development at the chalazal end of the embryo sac. (M) Late D3 seed containing autonomous cellular endosperm and no embryo. (N) Sexual P4 embryo sac containing a globular embryo and dividing endosperm nuclei. (O) Developing P4 seed containing an early-heart-stage embryo.
Figure 3.
Figure 3.
SERK-Like Genes in Hieracium. (A) Scheme of the AtSERK1 and DcSERK amino acid sequences showing the positions of the protein kinase domain and the degenerate primers (arrows). AA, amino acids. (B) Alignment of the putative amino acid sequences for AtSERK1 and DcSERK over the length of the Hieracium SERK-like (HpSERK-L) fragment. Nonconserved residues are highlighted in black, and similar residues are highlighted in gray. The positions of the kinase domains (II to VIII) are indicated above the sequences (Schmidt et al., 1997). (C) Genomic analysis of HpSERK-L. Genomic DNA samples were digested with EcoRI, which cuts external to the HpSERK-L fragment. (D) RT-PCR expression analysis of HpSERK-L during ovary development. Total RNA was isolated from stages 3, 5, and 8 of ovary development, which coincide with meiosis, megagametogenesis, and early embryo development, respectively. The diagrams indicate the approximate stages of embryo sac development. RT-PCR samples were compared to a β-tubulin control (β-tub). L, leaves.
Figure 4.
Figure 4.
AtSERK1:GUS and HpSERK-L mRNA Expression during Seed Development in Hieracium. (A) to (D) show cleared GUS-stained Hieracium ovaries viewed whole-mount or after sectioning (B) using DIC microscopy, and (E) to (H) show WISH samples viewed whole-mount or after sectioning (G) using Nomarski DIC microscopy. The numbers at top right indicate the ovary stage (Koltunow et al., 1998). Bars = 50 μm in (A), (B), (E), (F), and (H), 100 μm in (C) and (D), and 25 μm in (G). (A) Early ovule (ov) from sexual P4. (B) Thin section (2 μm) of a GUS-stained mature ovule from apomictic D3. (C) Fertilized P4 seed containing a globular embryo (em). (D) Seed from D3 containing two globular-to-heart stage embryos. (E) Early ovule from apomictic D2. (F) Anthesis ovule from apomictic D2 containing four small embryo structures, hybridized with antisense DcSERK probe. (G) Early globular embryos in a D2 seed hybridized with antisense DcSERK probe. (H) Seed from apomictic D2 containing a chalazal misshapen globular embryo and a micropylar heart-stage embryo hybridized with antisense DcSERK probe.
Figure 5.
Figure 5.
AtSPL:GUS Expression during Floral Development in Hieracium. Cleared GUS-stained Hieracium florets ([A] to [C]) and ovaries ([D] to [E]) viewed whole-mount using Nomarski DIC microscopy. The numbers at top right indicate the ovary stage (Koltunow et al., 1998). Bars = 50 μm in (A) to (C) and 25 μm in (D) to (G). (A) Early floret from apomictic D3 containing a small ovule (ov) and immature anthers (a). (B) Enlargement of an anther from apomictic D3 containing pollen mother cells (pmc). (C) Anthers from sexual P4 containing microspore tetrads (mt). (D) Ovule from sexual P4 containing a megaspore mother cell (mmc) showing GUS activity surrounded by the nucellar epidermis (ne). The funiculus (f) is indicated to aid orientation. (E) Ovule from sexual P4 showing four megaspores (ms), outlined with dashed lines, surrounded by the nucellar epidermis and the developing endothelium (et), outlined with solid lines. No staining is detected in the indicated structures. (F) Ovule from apomictic D3, showing the corresponding stage of apomictic development to (D), containing a megaspore mother cell showing GUS activity. (G) Ovule from apomictic D3, showing the corresponding stage of apomictic development to (E), containing an expanding aposporous initial cell (ai) chalazal to the degenerating megaspores (dms). No staining is detected in the indicated structures.
Figure 6.
Figure 6.
AtFIS2:GUS Expression during Early Ovule Development in Hieracium. Ovules from sexual Hieracium P4 ([A] to [D]), apomictic Hieracium D3 ([E] to [H]), and apomictic Hieracium A3.4 ([I] to [L]) were stained with GUS and viewed whole-mount using dark-field microscopy ([A], [E], and [I]) or Nomarski DIC microscopy. The numbers at top right indicate the ovary stage (Koltunow et al., 1998). Bars = 50 μm in (A), (E), (I), and (L) and 25 μm in (B) to (D), (F) to (H), (J), and (K). (A) P4 ovule in the chalazal (ch)-to-micropylar (mp) orientation showing GUS stain as pink. (B) Enlarging selected spore (ss) and blue GUS-stained degenerating megaspores (dms) surrounded by the nucellar epidermis (ne). Indicated structures are outlined with solid lines. (C) Enlarging functional megaspore (fm) with a large nucleus (n) chalazal to degenerated megaspores. Indicated structures are outlined with solid lines. (D) Ovule containing an early embryo sac (es) containing dividing embryo sac nuclei (esn) and surrounded by the endothelium (et). (E) D3 ovule showing the corresponding stage of apomictic development to (A). (F) Enlarging aposporous initial cell (ai) at the corresponding stage of apomictic development to (B). The aposporous initial cell, outlined with a broken line, forms in a slightly different plane than the other structures, which are outlined with solid lines. (G) Enlarging aposporous initial cell above two smaller initial cells. (H) D3 ovule containing a dividing aposporous embryo sac (aes) with embryo sac nuclei at the corresponding stage of apomictic development to (D). (I) A3.4 ovule showing the corresponding stage of apomictic development to (A) and (E). (J) Enlarging aposporous initial cells at the corresponding stage of apomictic development to (B) and (F). Multiple aposporous initial cells are indicated with broken lines, and some form in slightly different planes compared with the sexual structures, which are outlined with solid lines. (K) Enlarging aposporous initial cells. (L) Aposporous embryo sac structures at the corresponding stage of apomictic development to (D) and (H).
Figure 7.
Figure 7.
In Situ Hybridization and Genomic Analysis of AtFIS2:GUS in Hieracium. (A) to (D) show thin sections of AtFIS2:GUS sexual P4 ovules hybridized with antisense ([A] to [C]) or sense (D) labeled GUS RNA. (A) Megaspore mother cell (mmc) surrounded by the nucellar epidermis (ne). ov, ovule. Bar = 15 μm. (B) Ovule in the chalazal (ch)-to-micropylar (mp) orientation showing the megaspore tetrad (mt) outlined with a dashed line. Bar = 50 μm. (C) Magnified outlined region from (B) showing staining in the degenerating megaspores (dms) and some nucellar epidermis cells. No staining is evident in the selected spore (ss). Bar = 12.5 μm. (D) Ovule at a similar stage to that in (B), hybridized with sense GUS RNA. Bar = 50 μm. (E) DNA gel blot analysis of the AtFIS2:GUS transgene in apomictic D3 (independent lines 5, 7, and 12) and sexual P4 (independent lines 116 and 200) Hieracium. Genomic DNA (15 μg each) was digested with HindIII, which cuts the transgene only 5′ of the probed sequence, and EcoRV, which cuts the transgene on both sides of the probed sequence. The expected size of the EcoRV fragment is 575 bp. The lengths of the DNA fragments (kilobases) are indicated for each blot.
Figure 8.
Figure 8.
A Model for Apomixis in Hieracium. The numerals 1 and 2 indicate the checkpoints at which the sexual process is modified in apomictic Hieracium.

References

    1. Araujo, A.C.G., Mukhambetzhanov, S., Pozzobon, M.T., Santana, E.F., and Carneiro, V.T.C. (2000). Female gametophyte development in apomictic and sexual Brachiaria brizantha (Poaceae). Rev. Cytol. Biol. Veg. Botan. 23, 13–28.
    1. Barcaccia, G., Mazzucato, A., Albertini, E., Zethof, J., Gerats, A., Pezzotti, M., and Falcinelli, M. (1998). Inheritance of parthenogenesis in Poa pratensis L.: Auxin test and AFLP linkage analyses support monogenic control. Theor. Appl. Genet. 97, 74–82.
    1. Bicknell, R.A., and Borst, N.K. (1994). Agrobacterium-mediated transformation of Hieracium aurantiacum. Int. J. Plant Sci. 155, 467–470.
    1. Bicknell, R.A., Borst, N.K., and Koltunow, A.M. (2000). Monogenic inheritance of apomixis in two Hieracium species with distinct developmental mechanisms. Heredity 84, 228–237. - PubMed
    1. Boutilier, K., Offringa, R., Sharma, V.K., Kieft, H., Ouellet, T., Zhang, L., Hattori, J., Liu, C.M., van Lammeren, A.A., Miki, B.L., Custers, J.B., and van Lookeren Campagne, M.M. (2002). Ectopic expression of BABY BOOM triggers a conversion from vegetative to embryonic growth. Plant Cell 14, 1737–1749. - PMC - PubMed

Publication types

MeSH terms