. 2003 Jul 1;22(13):3254-66.
doi: 10.1093/emboj/cdg334.

Disruption of the endocytic protein HIP1 results in neurological deficits and decreased AMPA receptor trafficking

Affiliations

Disruption of the endocytic protein HIP1 results in neurological deficits and decreased AMPA receptor trafficking

Martina Metzler et al. EMBO J. .

Abstract

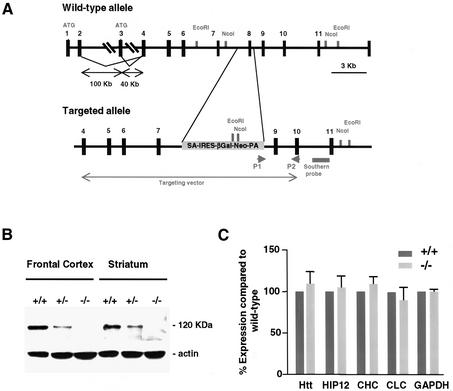
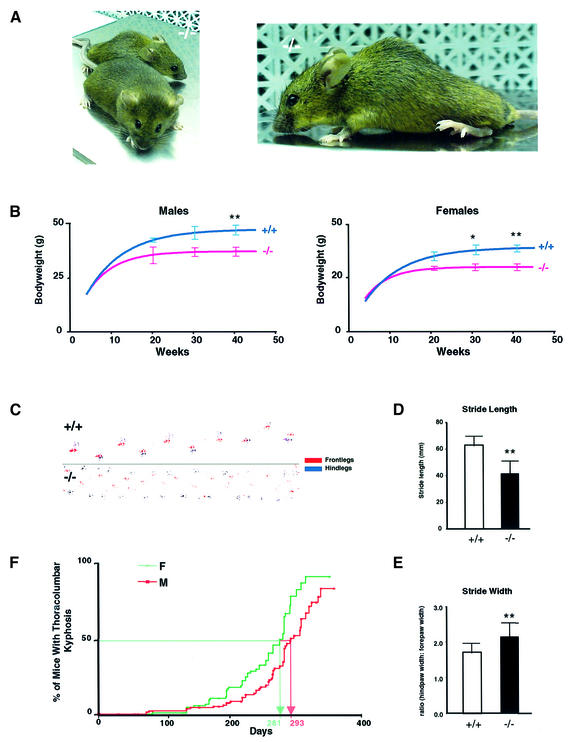
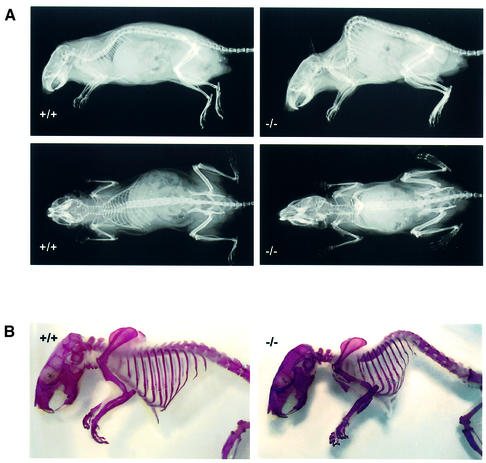
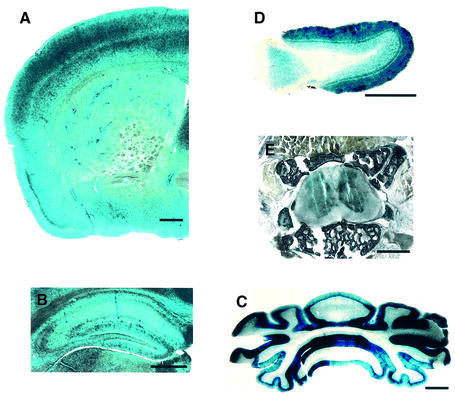
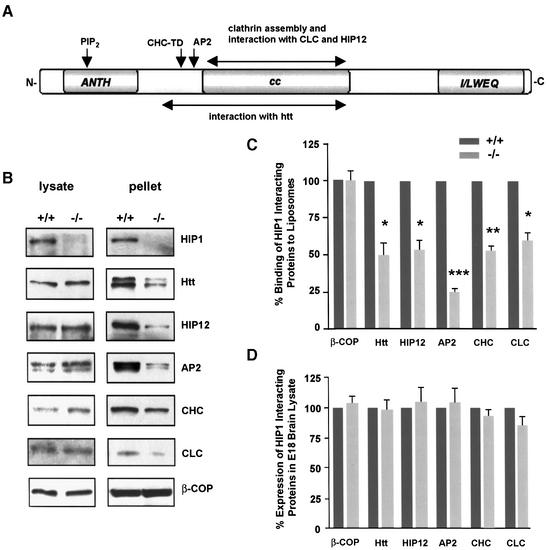
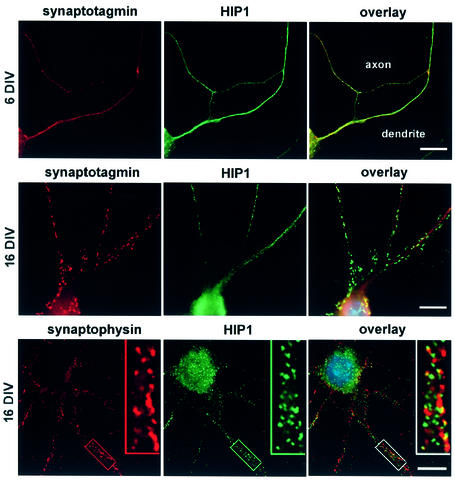
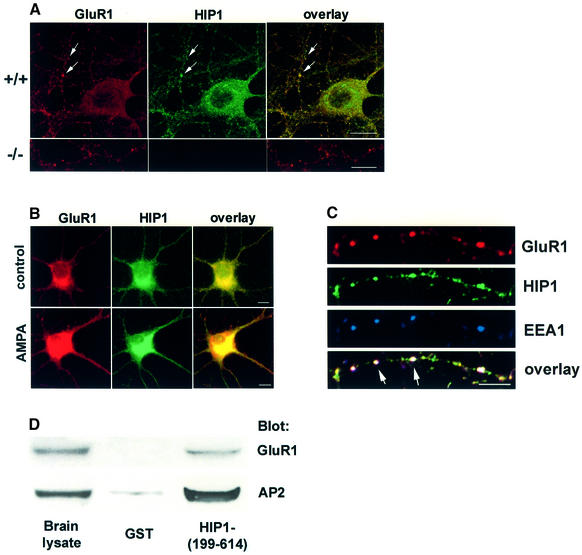
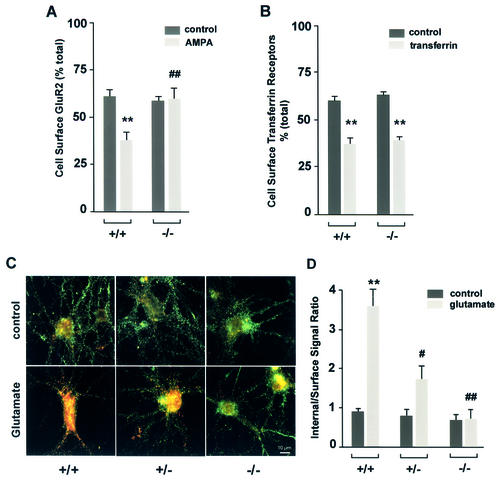
Huntingtin interacting protein 1 (HIP1) is a recently identified component of clathrin-coated vesicles that plays a role in clathrin-mediated endocytosis. To explore the normal function of HIP1 in vivo, we created mice with targeted mutation in the HIP1 gene (HIP1(-/-)). HIP1(-/-) mice develop a neurological phenotype by 3 months of age manifest with a failure to thrive, tremor and a gait ataxia secondary to a rigid thoracolumbar kyphosis accompanied by decreased assembly of endocytic protein complexes on liposomal membranes. In primary hippocampal neurons, HIP1 colocalizes with GluR1-containing AMPA receptors and becomes concentrated in cell bodies following AMPA stimulation. Moreover, a profound dose-dependent defect in clathrin-mediated internalization of GluR1-containing AMPA receptors was observed in neurons from HIP1(-/-) mice. Together, these data provide strong evidence that HIP1 regulates AMPA receptor trafficking in the central nervous system through its function in clathrin-mediated endocytosis.


Figures

None
Fig. 1. Generation of HIP1–/– mice that lack HIP1. (A) Schematic presentation of the HIP1 locus and the targeted allele. The closed arrow indicates the region that corresponds to the targeting vector. P1 and P2 indicate the location of primers that were used to identify homologous recombinant ES cell clones by PCR. (B) Lack of HIP1 expression in HIP1–/– mice is demonstrated by western blot analysis of tissues isolated from frontal cortex and striatum of wild-type (+/+), HIP1 (+/–) and HIP1 (–/–) mice. (C) Lack of HIP1 expression does not alter the expression level of HIP1 interacting proteins in brain lysates of adult wild-type (dark grey bars) and HIP1–/– mice (light grey bars).
None
Fig. 2. HIP1–/– mice develop a neurological phenotype. (A) A thoracolumbar kyphosis is evident in a 7-month-old HIP1 (–/–) mouse compared with its wild-type (+/+) littermate. (B) HIP1 (–/–) males (n = 81, left) and HIP1 (–/–) females (n = 83, right) exhibit a significant and sustained reduction in body weight in comparison with wild-type (+/+) males (n = 65, left) and wild-type (+/+) females (n = 81, right) 7–9 months after birth (*P < 0.05, **P < 0.005 by t-test). (C) HIP1 (–/–) mice with thoracolumbar kyphosis show gait abnormalities compared with wild-type (+/+) mice. (D) Stride length is significantly reduced in HIP1 (–/–) mice (n = 13) compared with wild type (+/+) (n = 14, **P < 0.005 by t-test). (E) Stride width is significantly increased in HIP1 (–/–) mice compared with wild type (+/+) (**P < 0.005 by t-test). (F) The percentage of male and female HIP1 (–/–) mice with thoracolumbar kyphosis is shown as a function of age. Females have a slightly earlier onset of the phenotype.
None
Fig. 3. The thoracolumbar kyphosis in HIP1–/– mice does not result from a congenital skeletal defect or dysplasia. (A) The presence of a thoracolumbar kyphosis is evident in X-rays from a 7-month-old HIP1 (–/–) mouse in comparison with its wild-type (+/+) littermate. Both mice are shown in lateral (top) and anteroposterior (bottom) views. (B) No congenital skeletal defect or dysplasia is evident in Alzarin Red-stained skeletons prepared from a HIP1 (–/–) mouse at 7 months of age in comparison with its wild-type (+/+) littermate.
None
Fig. 4. HIP1 is expressed in adult brain and spinal cord. (AE) HIP1 is expressed in coronal sections through the frontal cortex (A), the hippocampus (B), the cerebellum (C), the spinal cord (E) and in transverse sections through the olfactory bulb (D). Sections were prepared from 4-month-old HIP1–/– mice and analyzed by lacZ staining. Scale bar = 1 mm.
None
Fig. 5. The recruitment of endocytic proteins to liposomal membranes is decreased in brain lysate of HIP1–/– mice. (A) Schematic of HIP1 protein domains and sites of protein and phospholipid interaction. (B) Liposomal binding of endocytic proteins in brain lysates of wild-type (+/+) and homozygous (–/–) E18 embryos was analyzed by western blot. (C) The amount of bound protein in brain lysates from HIP1 (–/–) mice compared with wild type was determined by densitometry (n = 3, *P < 0.05, **P < 0.005, ***P < 0.0005 by t-test). (D) Expression of endocytic proteins in brain lysate of E18 wild-type (+/+) and HIP1 (–/–) embryos was analyzed by western blot and quantified by densitometry. Results represent the percentage of expressed protein in HIP1–/– mouse brain lysate relative to wild type (n = 3).
None
Fig. 6. HIP1 is expressed in the somatodendritic compartment in primary hippocampal neurons. HIP1 expression was analyzed by double immunofluorescence in primary hippocampal neurons after 6–21 days in culture. Synaptotagmin and synaptophysin immunolabeling is shown in red. HIP1 immunostaining was either detected with the mAb HIP1#9 (top and middle) or the pAb HIP1FP (bottom) and is shown in green. HIP1 does not colocalize with synaptic vesicle markers and shows a greater enrichment in the somatodendritic compartment. Nuclei were counterstained with DAPI shown in the electronic overlays (in blue). Scale bar = 10 µM.
None
Fig. 7. HIP1 colocalizes and interacts with GluR1. (A) Expression of GluR1 (in red) and HIP1 (in green) was analyzed by double immunofluorescence in primary hippocampal neurons from wild-type (top) and HIP1–/– littermates (bottom) after 15 DIV. Confocal images demonstrate extensive colocalization of HIP1 and GluR1 in dendrites and cell bodies (see arrows). No specific immunolabeling for HIP1 was detected in neurons derived from HIP1–/– mice. Scale bar = 10 µM. (B) Stimulation of hippocampal neurons with 100 µM AMPA for 10 min leads to relocalization of GluR1 (in red) and HIP1 (in green) and enrichment in cell bodies compared with control cultures. Scale bar = 10 µM. (C) GluR1 (in red), HIP1 (in green) and EEA1 (in blue) colocalize (see arrows) in primary hippocampal neurons stimulated with 100 µM AMPA for 5 min. Scale bar = 10 µM. (D) Soluble proteins from brain extracts were affinity-purified with equal amounts of either GST alone or a GST fusion protein encoding a fragment of HIP1 bound to glutathione–Sepharose beads. Proteins specifically bound to the beads were analyzed by western blot with anti-GluR1 and anti-AP2 Abs as indicated.
None
Fig. 8. AMPA receptor internalization is decreased in primary neurons of HIP1–/– mice. (A) Cortical neurons were established from wild-type (+/+) and homozygous (–/–) littermates. After 12–15 DIV the percentage of surface-expressed GluR2 was determined in a quantitative colorimetric assay in control and 100 µM AMPA-stimulated cultures under non-permeant and permeant conditions. (B) As in (A), the percentage of surface-expressed transferrin receptor was determined in a quantitative colorimetric assay in control and in cultures treated with 2 mg/ml apo-transferrin under non-permeant and permeant conditions. (C) Hippocampal neurons cultured from wild-type (+/+), heterozygous (+/–) and homozygous (–/–) littermates were first labeled with an Ab recognizing an extracellular epitope of GluR1, followed by treatment with either control solution (medium alone) or 100 µM glutamate for 10 min at 37°C. Surface GluR1 was then visualized using a green secondary Ab, whereas internalized GluR1 was labeled with a red secondary Ab. (D) Internalization was quantified as the red-to-green signal ratio, which represents the ratio of the internalized GluR1 to the GluR1 remaining on the cell surface after different treatments (see Materials and methods). Red-to-green ratios were averaged for each group in each of three different experiments (using three different batches of cultures). **P < 0.01 for within genotype, between treatment comparison; #P < 0.05 or ##P < 0.01 for within treatment, between genotype comparison.

References

    1. Ahle S., Mann,A., Eichelsbacher,U. and Ungewickell,E. (1988) Structural relationships between clathrin assembly proteins from the Golgi and the plasma membrane. EMBO J., 7, 919–929. - PMC - PubMed
    1. Brodsky F.M., Chen,C.Y., Knuehl,C., Towler,M.C. and Wakeham,D.E. (2001) Biological basket weaving: formation and function of clathrin-coated vesicles. Annu. Rev. Cell. Dev. Biol., 17, 517–568. - PubMed
    1. Buckley K.M., Melikian,H.E., Provoda,C.J. and Waring,M.T. (2000) Regulation of neuronal function by protein trafficking: a role for the endosomal pathway. J. Physiol., 525, 11–19. - PMC - PubMed
    1. Burbea M., Dreier,L., Dittman,J.S., Grunwald,M.E. and Kaplan,J.M. (2002) Ubiquitin and AP180 regulate the abundance of GLR-1 glutamate receptors at postsynaptic elements in C. elegans. Neuron, 35, 107–120. - PubMed
    1. Carroll R.C., Beattie,E.C., Xia,H., Luscher,C., Altschuler,Y., Nicoll,R.A., Malenka,R.C. and Von Zastrow,M. (1999) Dynamin-dependent endocytosis of ionotropic glutamate receptors. Proc. Natl Acad. Sci. USA, 96, 14112–14117. - PMC - PubMed

Publication types

LinkOut - more resources