. 2003 Jul;13(7):1563-71.
doi: 10.1101/gr.1161903.

An evolutionarily structured universe of protein architecture

Affiliations

An evolutionarily structured universe of protein architecture

Gustavo Caetano-Anollés et al. Genome Res. 2003 Jul.

Abstract

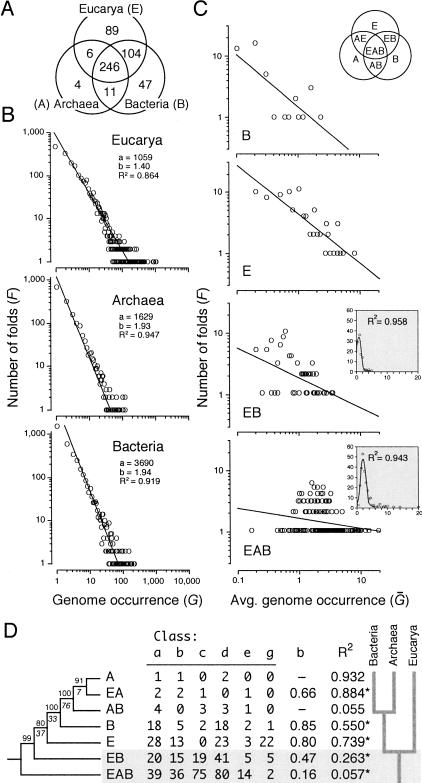
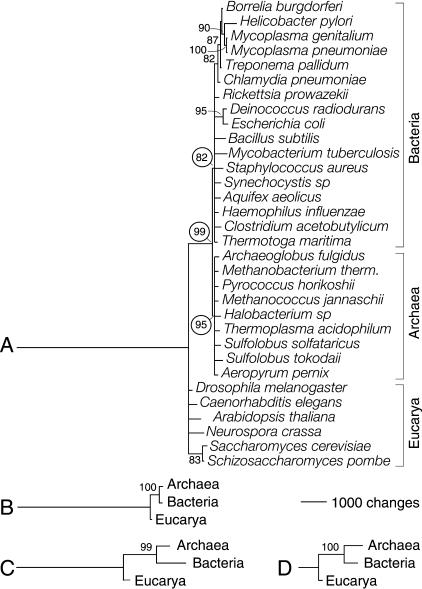
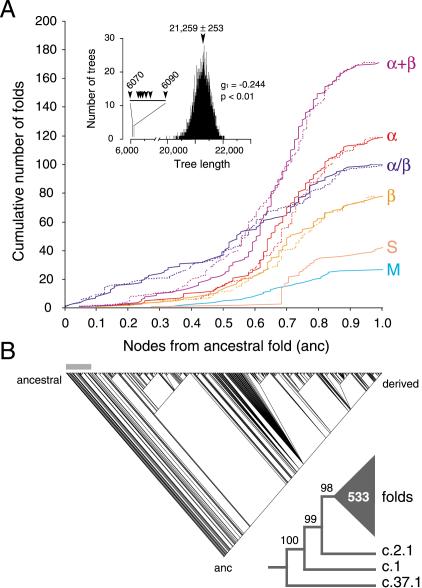
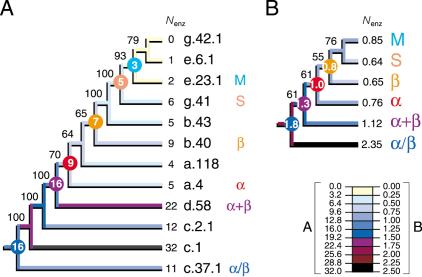
Protein structural diversity encompasses a finite set of architectural designs. Embedded in these topologies are evolutionary histories that we here uncover using cladistic principles and measurements of protein-fold usage and sharing. The reconstructed phylogenies are inherently rooted and depict histories of protein and proteome diversification. Proteome phylogenies showed two monophyletic sister-groups delimiting Bacteria and Archaea, and a topology rooted in Eucarya. This suggests three dramatic evolutionary events and a common ancestor with a eukaryotic-like, gene-rich, and relatively modern organization. Conversely, a general phylogeny of protein architectures showed that structural classes of globular proteins appeared early in evolution and in defined order, the alpha/beta class being the first. Although most ancestral folds shared a common architecture of barrels or interleaved beta-sheets and alpha-helices, many were clearly derived, such as polyhedral folds in the all-alpha class and beta-sandwiches, beta-propellers, and beta-prisms in all-beta proteins. We also describe transformation pathways of architectures that are prevalently used in nature. For example, beta-barrels with increased curl and stagger were favored evolutionary outcomes in the all-beta class. Interestingly, we found cases where structural change followed the alpha-to-beta tendency uncovered in the tree of architectures. Lastly, we traced the total number of enzymatic functions associated with folds in the trees and show that there is a general link between structure and enzymatic function.


Figures

Figure 1
Figure 1
Fold distribution, power-law behavior, and history of fold diversification in the three domains of life. (A) The Venn diagram shows the distribution of phylogenetically informative SCOP 1.59 folds in Eucarya, Archaea, and Bacteria (genomes analyzed are described in Fig. 2). (B) The double logarithmic plots show the relationship between the frequency (F) of a protein fold exhibiting a certain attribute and the attribute itself. In this case, the attribute is fold occurrence (G). The relationship between frequency and occurrence was fitted to a straight line (R2 = 0.864–0.947; P < 0.001) that drops off sharply and similarly for each genome (plots not shown) or group of genomes, according to a power law defined by constants a and b. This behavior follows Zipf's law, a description of the frequency of words in natural languages. (C) Double logarithmic plots also show the relationship between the frequency of folds with a particular pattern of distribution and the average number of times these folds occur in genomes within one or more organismal domains, normalized to a 0–20 scale (). The nomenclature of patterns of fold distribution is described in the Venn diagram (inset). All plots show significant linear correlations (P < 0.05; see below). However, values in the EAB and EB plots (binned to reduce noise in the data) can be best fitted to a Poisson distribution (P = 0.001) (insets). (D) The table shows the number of folds in the six classes of protein structure (named according to SCOP nomenclature) present in different distribution patterns among organismal domains, together with decay indices and coefficients of linear correlation (R2) describing the fit to a power law (*, P < 0.05). These values were coded (0–26) and weighted (4, 2.5, 3.5 6, 1, and 1, respectively) to compensate for fold representation differences. A single rooted tree of 520 steps (CI = 0.901, RI = 0.925; g1 = -1.460; PTP, P = 0.001) was recovered after an exhaustive search (D). BS values >80% are shown above nodes, and double decay indices below them (CIC = 13.34).
Figure 2
Figure 2
Phylogenetic reconstruction of a universal tree. Phylogenetic relationships were inferred from genomic abundance values of SCOP 1.59 fold categories. Bootstrap support (BS) values >80% are shown above nodes. (A) Reduced phylogenetic tree reconstructed from fold occurrence (G) data. A total of 507 informative out of 536 total characters with 20 character states each were analyzed. Two most-parsimonious trees of 16,157 steps (CI = 0.625, RI = 0.486; g1 = -0.659; PTP test, P = 0.001) were retained after a heuristic search with tree-bisection-reconnection (TBR) branch swapping and 50 replicates of random addition sequence. The tree shown is congruent with the 50% majority-rule consensus. The null hypothesis of congruence could not be rejected when folds in the six structural classes were tested for homogeneity of data partitions (P = 0.498). (B) Tree reconstructed from fold occurrence data averaged across genomes in each organismal domain (). Characters had 20 states, and 300 informative characters were analyzed. A single tree of 5885 steps (CI = 0.970, RI = 0.660; g1 = -0.702; PTP, P = 0.001) was retained after an exhaustive search. (C) Tree reconstructed from the fraction of genomes in each organismal domain that share individual folds (f). Characters had 17 states; 447 informative out of 507 total characters were analyzed. A single tree of 7603 steps (CI = 0.852, RI = 0.543; g1 = -0.559; PTP, P = 0.001) was retained after an exhaustive search. (D) Tree reconstructed as in C but from the subset of folds that is shared by the three organismal domains. Characters had 17 states, and 149 informative out of 246 total characters were analyzed. A single tree of 1601 steps (CI = 0.895, RI = 0.752; g1 = -0.672; PTP, P = 0.001) was retained after an exhaustive search.
Figure 3
Figure 3
Phylogenetic reconstruction of a universal tree of protein architecture. (A) Cumulative frequency plots illustrate the accumulation of folds in the six major classes of protein architecture along optimal (continuous lines) and suboptimal phylogenetic trees (dashed lines). Cumulative fold number is given as a function of distance in nodes from the hypothetical ancestral fold (anc) in a relative scale. Suboptimal tree reconstructions (spanning 6070 and 6090 steps) show that systematic and random error did not substantially affect the rates of fold accumulation. The inset shows tree distribution profiles and metrics of skewness. (B) One optimal most-parsimonious tree (6070 steps; CI = 0.105, RI = 0.773; PTP test, P = 0.001) was recovered from a heuristic search with TBR branch swapping and 10 replicates of random addition sequence. To decrease search times during branch swapping of suboptimal trees, only 10 trees of length ≥D + 1 were kept in each replicate, with D being the minimum tree length found in multiple iterative searches. The bar defines when protein classes occurred for the first time. The reduced cladogram shows branches with BS supports <98% collapsed into a multifurcation (triangle with number of multifurcating branches).
Figure 4
Figure 4
Reduced cladograms representing the phylogenetic relationships of folds belonging to individual protein classes. Branches with BS values <50% were collapsed into multifurcations (triangles with areas proportional to the number of folds unified by the polytomy). Trees were retained after heuristic searches with TBR branch swapping and 10 replicates of random addition sequence. Their lengths ranged from 786 steps (CI = 0.814, RI = 0.709; g1 = -2.215; PTP test, P = 0.001) for small proteins to 2375 steps (CI = 0.270, RI = 0.761; g1 = -0.528; PTP, P = 0.001) for the α/β protein class. Cladograms depicting trees with alternative reconstructions were congruent with the 50% majority-rule consensus.
Figure 5
Figure 5
Phylogenetic trees of all-β protein folds with β-barrel-like architecture. Maximum parsimony was used to reconstruct a general tree of β-barrel-like folds with different β-sheet topologies and barrel mimic folds (A) and trees of β-barrel folds with Greek-key, meander, and complex β-sheet topologies (B). Barrel mimic folds include architectures such as the barrel-sandwich hybrid, with two β-sheets in the shape of a half-barrel packed in a sandwich-like arrangement, and the β-clip, with two-stranded β-sheets that fold upon themselves. Folds are described by general characteristics such as barrel architecture [closed (C), partly open (P), or open barrel (O)], number of strands (n), and shear number (S), and special features (SF) such as cross-over psi loops (p), over-side connections (oc), capping by α-helices (c), and internal pseudo-threefoil symmetry (i). Trees with lengths ranging 659–768 steps [CI = 0.833–0.941, RI = 0.729–0.904; g1 = -(0.554–0.904); PTP tests, P = 0.001] were retained after branch-and-bound or exhaustive searches.
Figure 6
Figure 6
Tracing the evolutionary association of enzymatic function and protein architecture. Cladograms show the phylogenetic relationship of primitive folds (A) and protein classes (B) and were derived from a single tree of 907 steps (CI = 0.690, RI = 0.809; g1 = -0.911; PTP, P = 0.001) and 5209 steps (CI = 0.683, RI = 0.598; g1 = -0.792; PTP, P = 0.001) retained after branch-and-bound and exhaustive searches, respectively. The tree of protein classes was derived from fold occurrence data averaged across populated domains for each distribution pattern (Fig. 1) and for each of the six protein classes. The number of enzymatic functions (Nenz) was similarly averaged. Square-change parsimony was used to reconstruct ancestral Nenz states as continuous characters in the trees using McCLADE with the rooted option. These values are shown encircled for selected internal nodes.

References

    1. Ancel, L.W. and Fontana, W. 2000. Plasticity, evolvability, and modularity in RNA. J. Exp. Zool. Part B. Mol. Dev. Evol. 288: 242-283. - PubMed
    1. Apic, G., Gough, J., and Teichmann, S.A. 2001. An insight into domain combinations. Bioinformatics 17: S83-S89. - PubMed
    1. Aravind, L., Mazumder, R., Vasudevan, S., and Koonin, E.V. 2002a. Trends in protein evolution inferred from sequence and structure analysis. Curr. Opin. Struct. Biol. 12: 392-399. - PubMed
    1. Aravind, L., Anantharaman, V., and Koonin, E.V. 2002b. Monophily of class I aminoacyl tRNA synthetase, USPA, ETFP, photolyase, and PP-ATPase nucleotide-binding domains: Implications for protein evolution in the RNA world. Proteins 48: 1-14. - PubMed
    1. Bailey, J.A., Gu, Z., Clark, R.A., Reinert, K., Samonte, R.V., Schwartz, S., Adams, M.D., Myers, E.W., Li, P.W., and Eichler, E.E. 2002. Recent segmental duplications in the human genome. Science 297: 1003-1007. - PubMed

MeSH terms

LinkOut - more resources