. 2003 Jul 2;23(13):5599-606.
doi: 10.1523/JNEUROSCI.23-13-05599.2003.

Alteration of gene expression by chromosome loss in the postnatal mouse brain

Affiliations

Alteration of gene expression by chromosome loss in the postnatal mouse brain

Dhruv Kaushal et al. J Neurosci. .

Abstract

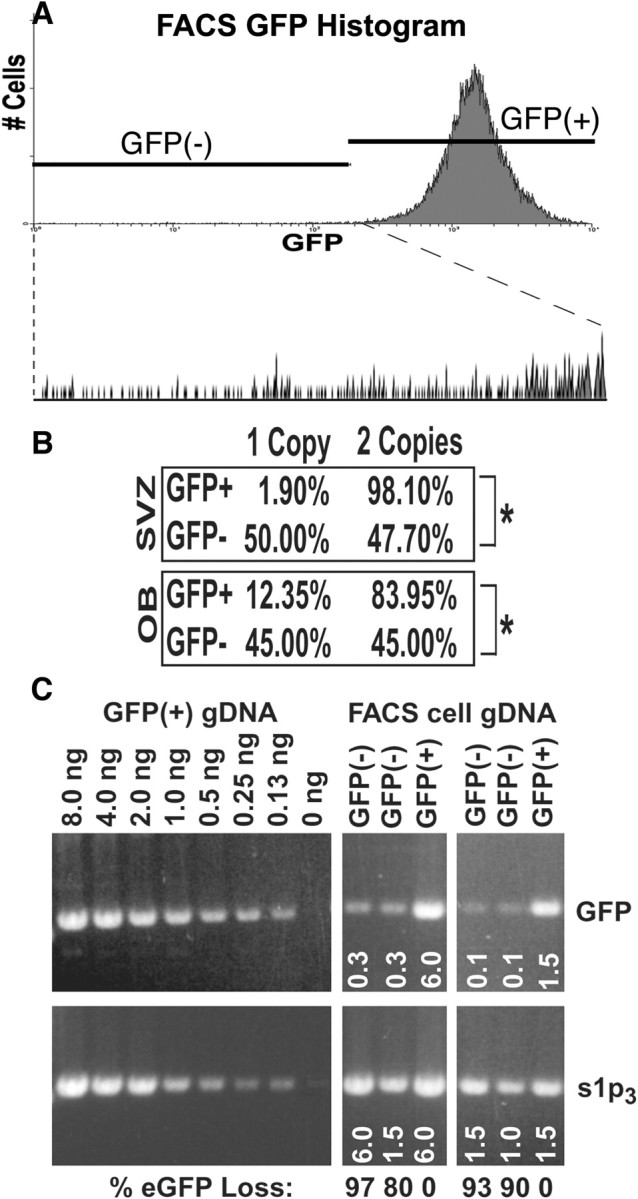
Frequent chromosomal aneuploidy has recently been discovered in normal neurons of the developing and mature murine CNS. Toward a more detailed understanding of aneuploidy and its effects on normal CNS cells, we examined the genomes of cells in the postnatal subventricular zone (SVZ), an area that harbors a large number of neural stem and progenitor cells (NPCs), which give rise to neurons and glia. Here we show that NPCs, neurons, and glia from the SVZ are frequently aneuploid. Karyotyping revealed that approximately 33% of mitotic SVZ cells lost or gained chromosomes in vivo, whereas interphase fluorescence in situ hybridization demonstrated aneuploidy in postnatal-born cells in the olfactory bulb (OB) in vivo, along with neurons, glia, and NPCs in vitro. One possible consequence of aneuploidy is altered gene expression through loss of heterozygosity (LOH). This was examined in a model of LOH: loss of transgene expression in mice hemizygous for a ubiquitously expressed enhanced green fluorescent protein (eGFP) transgene on chromosome 15. Concurrent examination of eGFP expression, transgene abundance, and chromosome 15 copy number demonstrated that a preponderance of living SVZ and OB cells not expressing eGFP lost one copy of chromosome 15; the eGFP transgene was lost in these cells as well. Although gene expression profiling revealed changes in expression levels of several genes relative to GFP-expressing controls, cells with LOH at chromosome 15 were morphologically normal and proliferated or underwent apoptosis at rates similar to those of euploid cells in vitro. These findings support the view that NPCs and postnatal-born neurons and glia can be aneuploid in vivo and functional gene expression can be permanently altered in living neural cells by chromosomal aneuploidy.


Figures

Figure 1.
Figure 1.
Chromosome displacement and aneuploidy in the SVZ. A, Schematic parasaggital view of P5 brain depicting the SVZ, RMS, and OB.B,Lowpower (20×) view of a parasaggital section of P5 SVZ stained with anti-phospho-H3 antibody (red) and DAPI (blue). Note the concentration of phospho-H3 positive mitotic cells in the SVZ. Scale bar, ∼50 μm. V, Lateral ventricle; D, dorsal; A, anterior. C, High power (100×) view of a single phospho-H3-positive cell (red) with displaced chromosomes (arrow). Note the displaced chromosomes stain with both DAPI and phospho-H3. Scale bar, ∼5 μm. D, Schematic SVZ karyotyping protocol. After dissection, SVZ explants are incubated with colcemid for 3 hr before dissociation and fixation. E, F, DAPI-stained aneuploid metaphase chromosome spreads. The cell in E has 38 chromosomes; the cell in F has 29. A euploid cell in the mouse has 40 chromosomes. G, Chromosome number histogram for 65 karyotyped metaphase cells (66% of cells karyotyped were euploid). Of aneuploid cells, the majority lost one or more chromosomes.
Figure 2.
Figure 2.
Migration of aneuploid cells to the olfactory bulb. A, Schematic experimental protocol. Male P7 mice were given a single intraperitoneal injection of BrdU and survived for 8 d before isolation of nuclei from the OB for FISH and BrdU detection. B, Examples of BrdU-positive euploid and aneuploid nuclei. FISH probes paint X (red) and Y (green) chromosomes. The BrdU+ cell in the bottom left (arrow) lost the Y chromosome, whereas the BrdU+ cell in the top right has both an X and a Y.
Figure 3.
Figure 3.
Aneuploidy among NPCs and their progeny in vitro. A, Schematic experimental protocol. SVZ cells were harvested from P5–P10 mice, cultured with 2% fetal calf serum or 20 ng/ml of EGF and 10 ng/ml of FGF-2 for 5–10 d before harvesting specific cell types using established methods. B, D, F, Nomarski and X (red) and Y (green) FISH images of cultured SVZ cells. C, E, Antibody-stained (blue) and X (red) and Y (green) FISH images of cultured SVZ cells. B, An SVZ-generated neuron without a Y chromosome (arrow). Note that the cell above it has both X and Y. C, An SVZ-generated, MAP-2-expressing neuron (blue) with two X chromosomes and one Y chromosome (arrow). The adjacent neuron is euploid. D, An SVZ-generated glial cell with no X chromosome (arrow). The cell in the bottom right is euploid. E, An SVZ-generated, GFAP immunoreactive glial cell (blue) that lost a Y chromosome (arrow). Note the glial cell in the adjacent panel E* is euploid. F, An aneuploid NPC (arrow) with one X chromosome and two Y chromosomes. The cell on the left has two X and two Y chromosomes, suggesting it is tetraploid.
Figure 4.
Figure 4.
Chromosome 15 loss is reported by loss of transgene expression in vitro. A, FISH detects an eGFP transgene integrated at a single locus on chromosome 15. (Two hybridization signals are visible in this chromatid pair.) eGFP expression is driven by the chicken β-actin promoter and cytomegalovirus enhancer; a high level of expression is expected in all cells in which the transgene is present. Subsequent analyses were performed in eGFP hemizygotes. B, C, Variation in eGFP fluorescence in SVZ cells in vitro. B is a Nomarski image and C shows eGFP fluorescence (green) and chromosome 15 FISH (red). Cells in boxes 1 (GFP–) and 2 (GFP+) are enlarged in adjacent panels. Boxes 1 and 2, GFP– cells frequently have only one copy of chromosome 15 (red). Cells in box 1 are GFP– and have only one copy of chromosome 15. The cell in box 2 is GFP+ and has two copies of 15.
Figure 5.
Figure 5.
Chromosome 15 loss is a significant source of LOH in vivo. A, GFP fluorescence histogram from FACS sorting of P5 SVZ. Note that ∼2% of cells have very little GFP fluorescence (expanded view below). Similar results were obtained with OB cells (data not shown). B, Quantitation of chromosome 15 loss and gain among GFP+ and GFP– sorted cells from P5 SVZ and OB. Forty-five to fifty percent of GFP– cells have one copy of chromosome 15, whereas 88–98% of GFP+ cells have two copies. GFP+ and GFP– distributions from both SVZ and OB are significantly different from one another (*p < 0.00001;χ2 test). C, Ethidium bromide-stained gel showing PCR-amplified eGFP (chromosome 15) or s1p3 (chromosome 13). Known amounts of gDNA from tail tissue (left panels) were used as a standard for estimating template quantities. In the experimental samples (right panels), the template was gDNA from FACS-sorted GFP+ or GFP– brain cells. The estimated template gDNA quantities are indicated below the amplified fragments (ng). On the basis of these numbers, the percentage of eGFP loss in the samples was determined and is listed below each lane. Experimental sample determinations were repeated >8 times (also with distinct primer pairs for GFP and another control gene, s1p2), and the percentage of GFP loss averaged ∼90%.
Figure 6.
Figure 6.
Proliferation and survival of cells with LOH at chromosome 15 in vitro. A, B, Representative 40× micrographs of GFP fluorescence among live FACS-sorted GFP+ (A) and GFP– (B) cells 24 hr after sorting. Images in each row (AB, C–D, E–F) were captured using identical exposure and camera gain settings and depict areas with similar cell densities. Note that cells in the GFP– culture are clearly less fluorescent than GFP+ cells. C, D, Representative 20× micrographs of phospho-vimentin antibody staining of GFP+ (C) and GFP– (D) cells 24 hr after sorting. E, F, Representative 20× micrographs of cleaved caspase-3 staining of GFP+ (E) and GFP[mnus] (F) cells 24 hr after sorting. G, No change in rates of vimentin phosphorylation among GFP– cells relative to GFP+. The percentage of cells immunoreactive for phosphovimentin is presented as mean ± SE.

References

    1. Aboody KS, Brown A, Rainov NG, Bower KA, Liu S, Yang W, Small JE, Herrlinger U, Ourednik V, Black PM, Breakefield XO, Snyder EY ( 2000) Neural stem cells display extensive tropism for pathology in adult brain: evidence from intracranial gliomas. Proc Natl Acad Sci USA 97: 12846–12851. - PMC - PubMed
    1. Allen DM, van Praag H, Ray J, Weaver Z, Winrow CJ, Carter TA, Braquet R, Harrington E, Ried T, Brown KD, Gage FH, Barlow C ( 2001) Ataxia telangiectasia mutated is essential during adult neurogenesis. Genes Dev 15: 554–566. - PMC - PubMed
    1. Alvarez-Buylla A, Garcia-Verdugo JM ( 2002) Neurogenesis in adult subventricular zone. J Neurosci 22: 629–634. - PMC - PubMed
    1. Barch MJ, Knudsen T, Spurbeck JL ( 1997) The AGT cytogenetics laboratory manual, Chap 3, Ed 3. Philadelphia: Lippincott–Raven.
    1. Chun J, Schatz DG ( 1999a) Developmental neurobiology: alternative ends for a familiar story? Curr Biol 9: R251–R253. - PubMed

Publication types

MeSH terms

Substances

LinkOut - more resources