. 2003 Jul 2;23(13):5698-707.
doi: 10.1523/JNEUROSCI.23-13-05698.2003.

Properties and functional role of voltage-dependent potassium channels in dendrites of rat cerebellar Purkinje neurons

Affiliations

Properties and functional role of voltage-dependent potassium channels in dendrites of rat cerebellar Purkinje neurons

Marco Martina et al. J Neurosci. .

Abstract

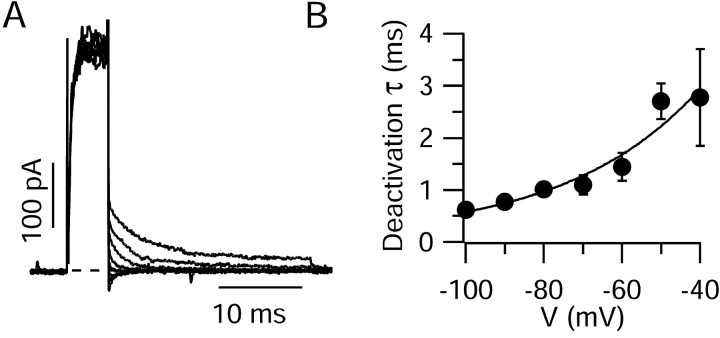
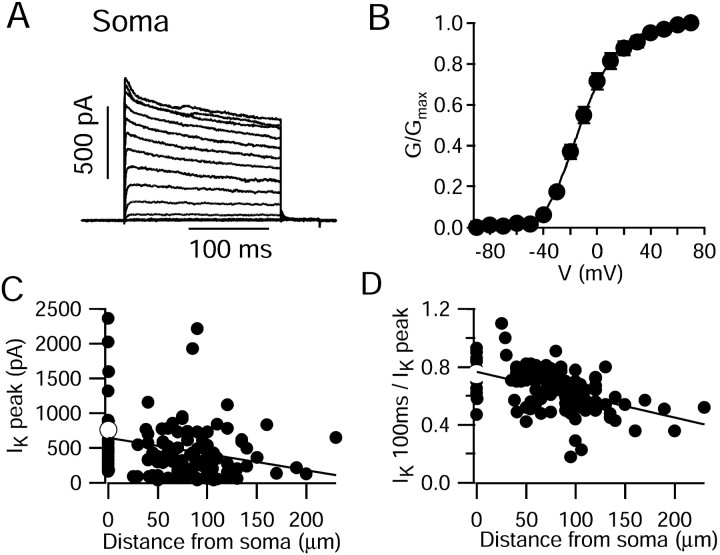
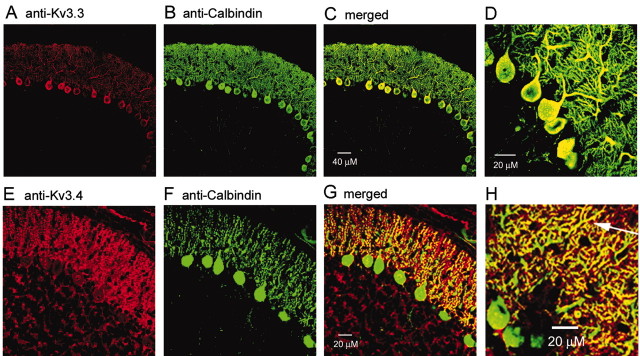
We characterized the properties and functional roles of voltage-dependent potassium channels in the dendrites of Purkinje neurons studied in rat cerebellar slices. Using outside-out patches formed <or=250 microm away from the soma, we found that depolarization-activated potassium channels were present at high density throughout the dendritic tree. Currents required relatively large depolarizations for activation (midpoint, approximately -10 mV), had rapid activation and deactivation kinetics, and inactivated partially (20-70% over 200 msec) with both fast (time constant, 15-20 msec) and slow (300-400 msec) components. Inactivating and noninactivating components were both blocked potently by external tetraethylammonium (half-block by 150 microm) and 4-aminopyridine (half-block by 110 microm). The voltage dependence, kinetics, and pharmacology suggest a predominant contribution by Kv3 family subunits, and immunocytochemical experiments showed staining for both Kv3.3 and Kv3.4 subunits in the dendritic tree. In the proximal dendrite, potassium channels were activated by passively spread sodium spikes recorded at the same position, and experiments using dual recordings showed that the channels serve to actively dampen back-propagation of somatic sodium spikes. In more distal dendrites, potassium currents were activated by voltage waveforms taken from climbing fiber responses, suggesting that they help shape these responses as well. The requirement for large depolarizations allows dendritic Kv3 channels to shape large depolarizing events while not disrupting spatial and temporal summation of smaller excitatory postsynaptic potentials.


Figures

Figure 1.
Figure 1.
Voltage dependence and kinetics of activation of dendritic potassium currents. A, Potassium currents elicited in an outside-out patch taken from a Purkinje cell dendrite (140 μm from the soma) by 200 msec steps from a holding potential of –90 mV to voltages from –80 to 70 mV (10 mV intervals). B, Peak conductance–voltage relationship for dendritic patches (mean ± SEM; 16 cells). Conductance was calculated assuming a reversal potential of –95 mV and a linear current–voltage curve for open channels. The solid curve is given by Boltzmann function raised to the fourth power: [1/(1 + exp [-(V-Vh)/k])] 4, where V is the membrane potential, Vh is the potential at which the Boltzmann function is 0.5, and k is the slope factor. Vh is –46 mV, and the slope factor is 20 mV. This function reaches a midpoint at a value of Vh + 1.67*k, or –13 mV. C, Time course of activation at higher time resolution. D, Time for current to rise from 10 to 90% of its peak value plotted against test pulse voltage for 16 dendritic patches. These parameters are fits to the averaged data. Table 1 shows the values for midpoint, k, and noninactivating fraction obtained by averaging fits to data from individual patches.
Figure 2.
Figure 2.
Rapid deactivation of dendritic potassium currents. A, Potassium currents elicited in a dendritic outside-out patch (taken from dendrite 120 μm from soma) with a 5 msec step to 70 mV to fully activate the channels followed by repolarization to voltages from –110 to –40 mV in 10 mV increments. Tail currents reversed between –80 and –90 mV. B, Collected data (mean ± SEM) from four dendritic patches. Protocols were as in A, except that both shorter (5 msec) and longer (100 msec) activating steps to 70 mV were used. With the longer activating pulses, the reversal potential of tail currents was approximately –50 mV, probably reflecting accumulation of potassium ions on the external surface of the patch. This facilitated the measurement of time constants at –80 and –90 mV. Time constants did not depend on the length of the activation pulse or the direction of current flow.
Figure 3.
Figure 3.
Voltage dependence and kinetics of inactivation of potassium current in dendritic patches. A, Potassium current elicited by a 200 msec pulse from –90 to 70 mV in a dendritic outside-out patch taken 140 μm from the soma. Inactivation could be fit by two exponentials plus a constant, and the experimental trace is overlaid by a fitted curve with 18% of the current decaying with a time constant of 2.5 msec, 43% with a time constant of 68 msec, and 39% nondecaying. B, Voltage dependence of inactivation determined by changing the holding potential for 5 sec before a test pulse to 70 mV (patch taken 70 μm from the soma). C, Peak test pulse current versus prepulse voltage for prepulses of 5 sec (filled circles; mean ± SEM; n = 6) or 100 msec (open circles; mean ± SEM; n = 10). Average values are fit by a Boltzmann function decaying to a non-zero fraction, NI + (1 – NI)/(1 + exp[(VVh)/k]), where NI is the fraction of noninactivating current, Vh is the midpoint for the inactivating fraction, and k is the slope factor for the inactivating fraction. For 5 sec prepulses, Vh = –39 mV, k = 11.0 mV, and NI = 0.07. For 100 msec prepulses, Vh = –32 mV, k = 7.3 mV, and NI = 0.63. These parameters are for fits to the averaged data. Table 1 shows the values for Vh, k, and noninactivating fraction obtained by averaging fits to data from individual patches.
Figure 4.
Figure 4.
Dependence of potassium current amplitude and degree of inactivation on distance from soma. A, Potassium currents elicited in a somatic patch by 200 msec steps from a holding potential of –90 mV to voltages from –80 to 70 mV (10 mV intervals). B, Peak conductance–voltage relationship for somatic patches (mean ± SEM; 18 cells). Conductance was calculated assuming a reversal potential of –95 mV and a linear current–voltage curve for open channels. Solid curve is a Boltzmann function raised to the fourth power, with a midpoint potential of –11.5 mV and slope factor 18 mV. C, Magnitude of peak potassium current (step from –90 to 70 mV) in outside-out patches, plotted as a function of distance from the soma from which the patch was formed (closed circles). To facilitate the comparison, only data obtained with 7–11 MΩ pipettes are plotted. The white symbol indicates mean ± SEM for patches from the cell body with the same range of electrode resistances. The solid line is leastsquares to the data and has an x-intercept of 652 pA and slope of –2.3 pA/μm. D, The ratio of the current remaining after 100 msec to the peak current is plotted versus distance from soma (closed circles). Steps were to 70 mV. The white symbol indicates mean ± SEM for patches from the cell body. Solid line is least-squares to the data and has an x-intercept of 0.77 and slope of –0.0016 μm 1.
Figure 5.
Figure 5.
Pharmacology of dendritic potassium currents. A, Effects of increasing concentrations of external TEA on currents evoked by 200 msec pulses from –90 to 70 mV in a dendritic patch (excised 50 microns from soma). B, Dose–response curve for block of dendritic current by external TEA. The solid curve represents fit by the logistic equation to the data up to 3 mm TEA, 0.8/[1 + (TEA)/Kd] + 0.2, with Kd = 85 μm. C, Effect of 4-AP on currents from a dendritic outside-out patch (excised 75 microns from soma). D, Dose–response curve for block of dendritic current by 4-AP. The solid curve represents fit by the logistic equation with variable slope (Hill coefficient) given by 0.81/(1 + [(4-AP)/Kd]n) + 0.19, with Kd = 86 μm and n = 1.7.
Figure 6.
Figure 6.
Immunostaining for Kv3.3 and Kv3.4 subunits in somata and dendrites of Purkinje neurons. A, Confocal image of Purkinje cell layer after staining with antibodies to Kv3.3 (red). B, Same slice stained using primary antibodies to calbindin (green). C, Merged image. D, Higher magnification merged image of staining by Kv3.3 (red) and calbindin (green). E–G, Staining with antibodies to Kv3.4 (E, red), calbindin (F, green), and merged image (G).H, Higher magnification merged image of staining by Kv3.4 (red) and calbindin (green). Note the colocalization of the antibodies in many regions of distal dendrites (including that marked by an arrow). For both Kv3.3 and Kv3.4 staining, controls were run by staining adjacent sections and processing them in parallel except that the antibodies were preincubated with 100-fold excess of antigenic peptide; there was only very faint nonspecific staining of cell body cytoplasm present in the controls.
Figure 7.
Figure 7.
Activation of dendritic potassium current by truncated dendritic spikes. A, Peak amplitude of dendritic action potentials (from spontaneous firing of neurons with no injected current) plotted against distance from soma. The dashed line represents the average voltage at which dendritic K+ currents activate by ∼10%. Inset, voltage traces of spontaneous activity obtained recording simultaneously from soma and dendrite of a Purkinje neuron. B, Voltage traces recorded from another dendrite (top); the recordings used as voltage command activated potassium currents in the outside-out patch obtained from the same dendrite.
Figure 8.
Figure 8.
Dendritic potassium channels actively depress and narrow sodium spikes in the dendrite. A, A double recording was performed from soma and dendrite of a Purkinje neuron in the presence of 300 nm TTX. The soma was voltage clamped with a trace of Purkinje neuron spontaneous activity (A). The dendritic pipette recorded in current-clamp passively spread action potential either in control condition or after bath application of 1 mm TEA (B). C, The first action potential in the train (area indicated by arrows) shown on an expanded scale. Note the large increase in spike duration and the incomplete repolarization induced by TEA.
Figure 9.
Figure 9.
Activation of dendritic potassium current by climbing fiber response. A, Voltage response to climbing fiber stimulation recorded in a dendrite at 75 μm from the soma. B, After forming an outside-out patch using the same pipette at the same location, the recorded voltage response was used as voltage command to record the potassium current elicited in the dendrite by the EPSP.

Similar articles

Cited by

References

    1. Bekkers JM ( 2000) Distribution and activation of voltage-gated potassium channels in cell-attached and outside-out patches from large layer 5 cortical pyramidal neurons of the rat. J Physiol (Lond) 525: 611–620. - PMC - PubMed
    1. Callaway JC, Ross WN ( 1997) Spatial distribution of synaptically activated sodium concentration changes in cerebellar Purkinje neurons. J Neurophysiol 77: 145–152. - PubMed
    1. Cavelier P, Pouille F, Desplantez T, Beekenkamp H, Bossu JL ( 2002) Control of the propagation of dendritic low-threshold Ca2+spikes in Purkinje cells from rat cerebellar slice cultures. J Physiol (Lond) 540: 57–72. - PMC - PubMed
    1. Cingolani LA, Gymnopoulos M, Boccaccio A, Stocker M, Pedarzani P ( 2002) Developmental regulation of small-conductance Ca2+-activated K+ channel expression and function in rat Purkinje neurons. J Neurosci 22: 4456–4467. - PMC - PubMed
    1. Christie BR, Eliot LS, Ito K, Miyakawa H, Johnston D ( 1995) Different Ca2+ channels in soma and dendrites of hippocampal pyramidal neurons mediate spike-induced Ca2+ influx. J Neurophysiol 73: 2553–2557. - PubMed

Publication types

LinkOut - more resources