. 2003 Jul 2;23(13):5740-9.
doi: 10.1523/JNEUROSCI.23-13-05740.2003.

Metabolic mapping of mouse brain activity after extinction of a conditioned emotional response

Affiliations

Metabolic mapping of mouse brain activity after extinction of a conditioned emotional response

Douglas Barrett et al. J Neurosci. .

Abstract

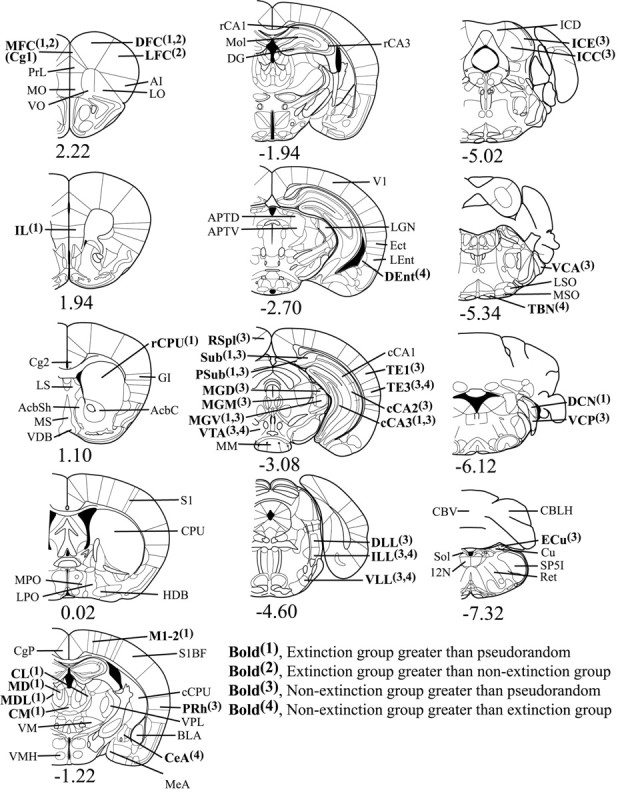
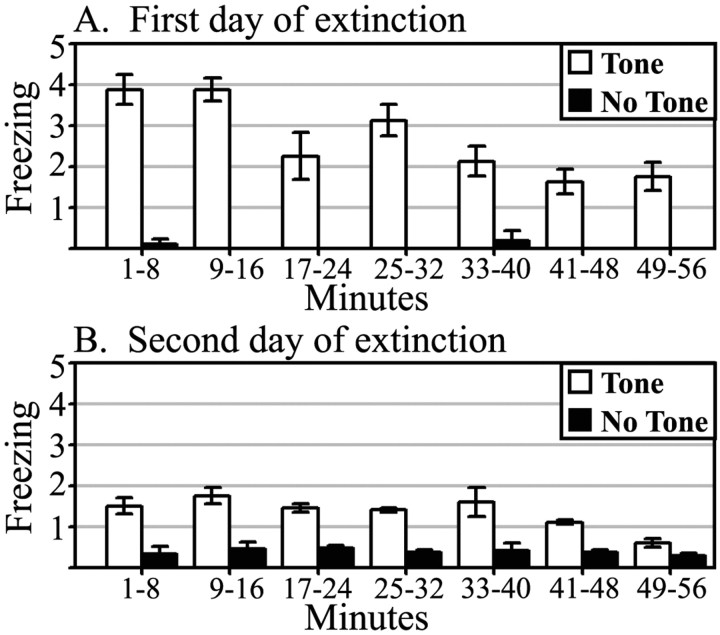
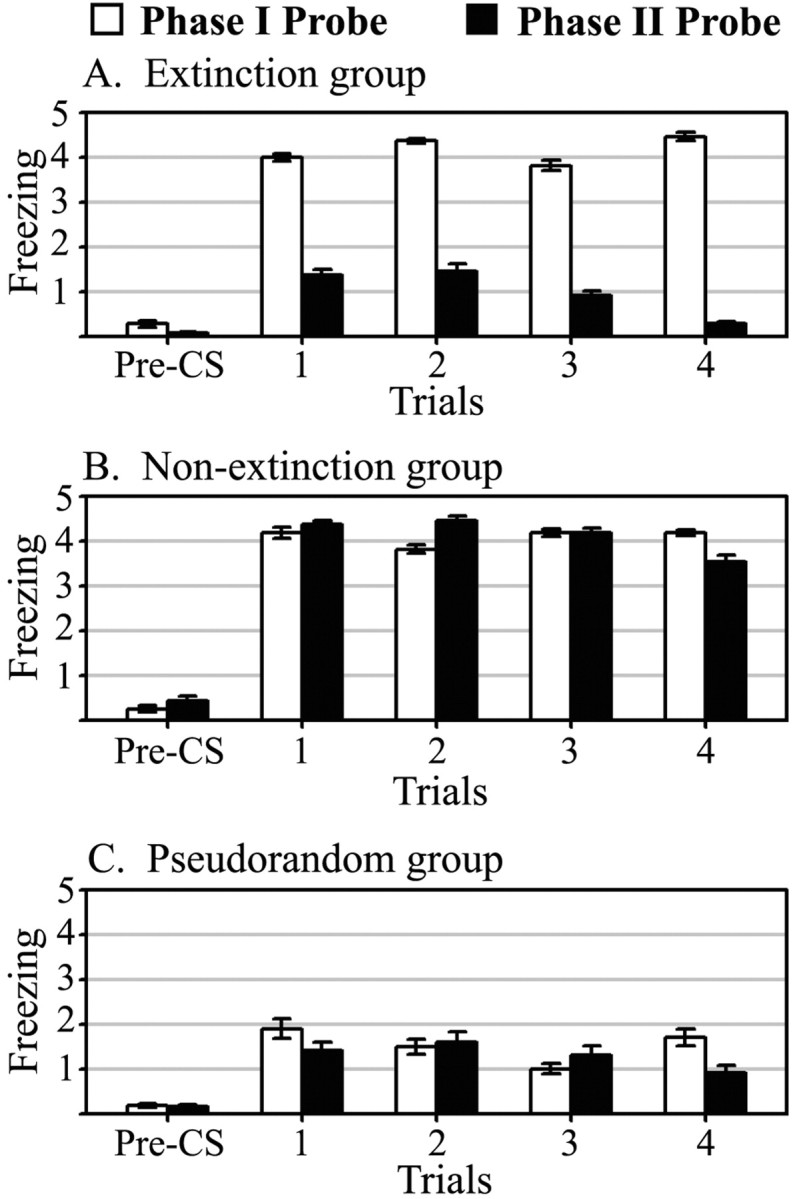
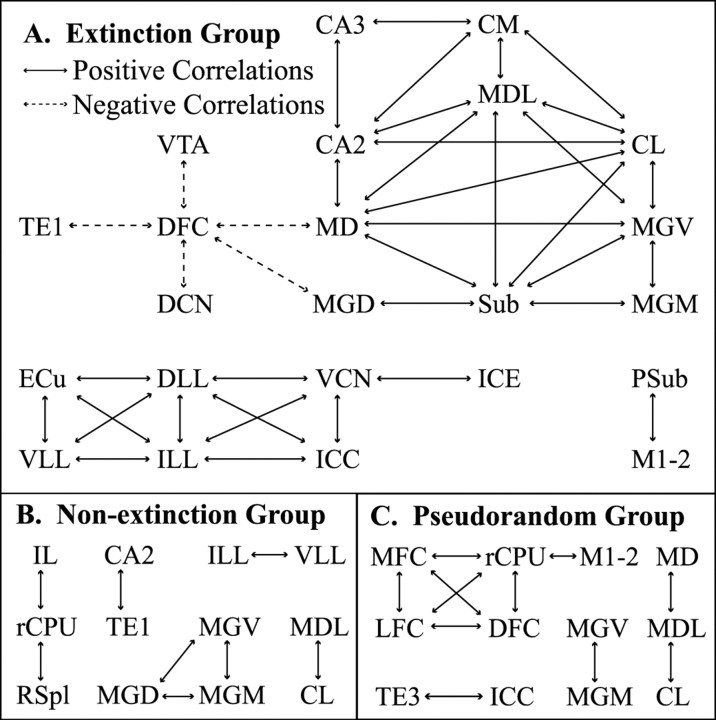
Metabolic mapping with fluorodeoxyglucose (FDG), a radiolabeled glucose analog, was used to assess regional activity changes in the mouse brain that result from extinction of a conditioned emotional response (CER). In the extinction group, Pavlovian tone-foot shock conditioning, followed by repeated tone-alone presentations, resulted in the reduction of the CER (freezing behavior). A second group underwent CER acquisition alone (nonextinction group), and a third group showed no CER after pseudorandom training. Then mice were injected with FDG, and tone-evoked brain activity was mapped. In the auditory system, increased activity resulted from the associative effects of acquisition training. Effects common to extinction and nonextinction groups, presumably reflecting the tone-foot shock association independently of CER expression, were found in the medial geniculate, hippocampus, and subiculum. In the extinction group, a major finding was the elevated activity in prefrontal cortex regions. In addition, brain-behavior correlations between FDG uptake and freezing behavior confirmed that subjects with higher prefrontal activity were more successful at inhibiting the CER. Interregional activity correlations showed extensive functional coupling across large-scale networks in the extinction group. The increased activity of the prefrontal cortex and its negative interactions with other regions within the extinction group suggest a functional network inhibiting the CER composed of prefrontal cortex, medial thalamus, auditory, and hippocampal regions. This is the first time that such a functional network resulting from Pavlovian extinction has been demonstrated, and it supports Pavlov's original hypothesis of extinction as the formation of cortical inhibitory circuits, rather than unlearning or reversal of the acquisition process.


Figures

Figure 3.
Figure 3.
Coronal brain diagrams of locations of regions of interest by bregma level. The significant mean activity differences (p < 0.01) observed in each region are indicated in boldface. Anterior–posterior bregma coordinates are indicated below each diagram. [Section diagrams were reproduced with permission from Paxinos and Franklin (2001)]. MFC, Medial frontal cortex [Cg1 in Paxinos and Franklin (2001)]; PrL, prelimbic frontal cortex; MO, medial orbital cortex; VO, ventral orbital cortex; DFC, dorsal frontal cortex; LFC, lateral frontal cortex; AI, agranular insular cortex; LO, lateral orbital cortex; IL, infralimbic cortex; Cg2, anterior cingulate; LS, lateral septal nucleus; MS, medial septal nucleus; AcbSh, accumbens shell; AcbC, accumbens core; VDB, ventral diagonal band nucleus; rCPU, caudate–putamen rostral; GI, granular insular cortex; MPO, medial preoptic area; LPO, lateral preoptic area; HDB, horizontal limb of diagonal band posterior; S1, parietal cortex anterior; CPU, caudate–putamen middle; CgP, posterior cingulate; CL, central lateral thalamic nucleus; MD, medial dorsal thalamic nucleus; MDL, medial dorsal lateral thalamic nucleus; CM, centromedial thalamic nucleus; VM, ventromedial thalamic nucleus; VMH, ventromedial hypothalamus; M1–2, parietal cortex medial; S1BF, parietal cortex lateral; cCPU, caudate–putamen caudal; PRh, perirhinal cortex anterior; VPL, ventral posterior lateral thalamic nucleus; BLA, basolateral amygdala; CeA, central amygdala; MeA, medial amygdala; rCA1, anterior hippocampus CA1; rCA3, anterior hippocampus CA3; DG, dentate gyrus; Mol, hippocampal molecular layers; APTD, anterior pretectal area dorsal; APTV, anterior pretectal area ventral; V1, visual cortex; LGN, lateral geniculate nucleus; Ect, ectorhinal cortex posterior; LEnt, lateral entorhinal cortex; DEnt, deep entorhinal cortex; RSpl, retrosplenial cortex; Sub, subiculum; Psub, presubiculum; MGD, medial geniculate nucleus dorsal; MGM, medial geniculate nucleus medial; MGV, medial geniculate nucleus ventral; VTA, ventral tegmental area; MM, mammillary bodies; cCA1, posterior hippocampus CA1; cCA2, posterior hippocampus CA2; cCA3, posterior hippocampus CA3; TE1, auditory cortex dorsal; TE3, auditory cortex ventral; DLL, lateral lemniscus nucleus dorsal; ILL, lateral lemniscus nucleus intermediate; VLL, lateral lemniscus nucleus ventral; ICD, inferior colliculus nucleus dorsal; ICE, inferior colliculus nucleus external; ICC, inferior colliculus nucleus, central; VCA, ventral cochlear nucleus anterior; LSO, lateral superior olivary nucleus; MSO, medial superior olivary nucleus; TBN, trapezoid body nucleus; DCN, dorsal cochlear nucleus; VCP, ventral cochlear nucleus posterior; CBV, cerebellum vermis; CBLH, cerebellum lateral hemisphere; ECu, external cuneate nucleus; Cu, cuneate nucleus; SP5I, spinal trigeminal nucleus; Ret, medullary reticular formation; Sol, solitary tract nucleus; 12N, hypoglossal nucleus.
Figure 1.
Figure 1.
Freezing behavior during first (A) and second (B) day of extinction sessions. The CER was scored during tone-alone presentations and averaged across 8 min bins. White bars represent counts of freezing during tone CS; black bars represent counts of freezing with no tone CS, as measured before tone onset.
Figure 2.
Figure 2.
Probe trial freezing behavior. Data for each of four tone CS presentations during probe sessions I and II are shown. White bars represent counts of freezing during probe I (post-acquisition); black bars represent counts of freezing during probe II (post-extinction). Pre-CS freezing was measured during the 15 sec before tone onset and averaged across trials.
Figure 4.
Figure 4.
Pair-wise interregional activity correlations by group. Solid arrows indicate significant positive correlations in metabolic activity between two regions; dashed arrows indicate significant negative correlations (p < 0.01). The extensive functional coupling in the extinction group implies the existence of a network of thalamic, hippocampal, and auditory regions, with frontal cortex showing negative correlations with other regions. The significant correlation values by group can be found in supplementary Table C (available at www.jneurosci.org).

References

    1. Falls WA ( 1998) Extinction: a review of theory and the evidence suggesting that memories are not erased with nonreinforcement. In: Learning and behavior therapy (O'Donohue W, ed), pp 205–229. Boston: Allyn and Bacon.
    1. Fanselow MS ( 1989) The adaptive function of conditioned defensive behavior: an ecological approach to Pavlovian stimulus-substitution theory. In: Ethoexperimental approaches to the study of behavior (Blanchard RJ, Brain PF, Blanchard DC, Parmigiani S, eds), pp 151–166. Boston: Kluwer.
    1. Gewirtz JC, Falls WA, Davis M ( 1997) Normal conditioned inhibition and extinction of freezing and fear-potentiated startle following electrolytic lesions of medial prefrontal cortex in rats. Behav Neurosci 111: 712–726. - PubMed
    1. Goddard GV ( 1964) Functions of the amygdala. Psychol Bull 62: 89–109. - PubMed
    1. Gonzalez-Lima F ( 1992) Brain imaging of auditory learning functions in rats: studies with fluorodeoxyglucose autoradiography and cytochrome oxidase histochemistry. In: Advances in metabolic mapping techniques for brain imaging of behavioral and learning functions (Gonzalez-Lima F, Finkenstädt T, Scheich H, eds), pp 39–109. Boston: Kluwer.

Publication types

Substances

LinkOut - more resources