. 2003 Jul 2;23(13):5865-76.
doi: 10.1523/JNEUROSCI.23-13-05865.2003.

Post-traumatic hyperexcitability is not caused by impaired buffering of extracellular potassium

Affiliations

Post-traumatic hyperexcitability is not caused by impaired buffering of extracellular potassium

Vijayalakshmi Santhakumar et al. J Neurosci. .

Abstract

Impaired extracellular potassium buffering has been proposed as one of the major mechanisms underlying the increased risk for temporal lobe epilepsy after brain injury (D'Ambrosio et al., 1999). The present study systematically tested this hypothesis by measuring the resting [K+]o and recovery of the stimulation-evoked [K+]o increases in the dentate gyrus after experimental head trauma, using a combination of whole-cell recordings and ion-selective microelectrode recordings in rat hippocampal slices. Despite the presence of hyperexcitability, the resting [K+]o was not increased after injury. The faster rate of increase and larger amplitude of the orthodromically evoked [K+]o elevation after head trauma occurred in association with a greater population spike with shorter response latency. Contrary to the assumption in previous studies that the evoked activity in control and injured neuronal circuits is the same during antidromic activation, stimulation of granule cell axons in glutamate receptor antagonists evoked a greater [K+]o increase and a larger population spike. Although perforant path stimulation resulted in a larger [K+]o elevation after injury, the rate of clearance of the [K+]o transients evoked either by neuronal activity or by external application of potassium was not compromised. The [K+]o increase evoked by activation of the presynaptic afferents in isolation was not increased. In addition, the postsynaptic neuronal depolarization and firing evoked by exogenous potassium application was decreased after trauma. These results show that the regulation of [K+]o is not impaired after injury and indicate that the larger [K+]o increase evoked by neuronal activity is a consequence, rather than the primary mechanism underlying post-traumatic hyperexcitability.


Figures

Figure 3.
Figure 3.
The rate of clearance of externally applied potassium is not impaired after head injury. A, Example of traces showing [K +]o elevation and clearance in the granule cell layer during pressure application of ACSF containing 10 mm potassium in 1μm TTX 1 week after injury (FPI) or sham operation (CON) (the y-axis showing [K +]o elevation above rest as a micromolar concentration is on a Nernstian scale). B, C, Summary data showing no difference in the either the fast (B) or the slow (C) exponential decay time constants of the externally applied potassium between slices from injured and control animals.
Figure 7.
Figure 7.
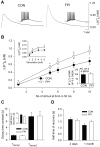
Post-traumatic decrease in granule cell firing in response to exogenous application of potassium. A, Representative voltage traces from granule cells in control animals (CON) and head-injured animals (FPI) show the post-traumatic decrease in depolarization and action potential firing evoked by exogenous potassium application. The traces were obtained by whole-cell patch-clamp recordings at -70 mV in 20 μm BMI, 20 μm AP-5, and 10 μm CNQX, 1 week after FPI. B, Summary data show the smaller potassium-evoked depolarization of granule cells from head-injured animals compared with controls from experiments similar to those in A. Inset in B shows that the difference in the potassium-induced depolarization was absent when QX-314 was present in the internal solution of the recording whole-cell pipette. C, Granule cell I/V plots from control animals (•; n = 5) and head-injured animals (○; n = 5) show that that there was no discernable difference in the voltage response evoked by +50 pA to -400 pA current steps (from a holding potential of -70 mV) after head trauma. Inset, Granule cell I/V plots from a subset of the cells, from control animals (•; n = 3) and injured animals (○; n = 3) in C in which larger current steps could also be tested, show that that there was no difference in the voltage response evoked by +50 pA to -700 pA current steps after head trauma.
Figure 1.
Figure 1.
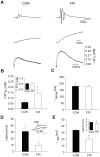
Resting [K +]o is not increased in the post-traumatic dentate gyrus. A, Field recordings of perforant path-evoked granule cell responses are shown, 1 week after moderate head injury in slices from a fluid percussion-injured animal (FPI) and an age-matched sham-control animal (CON) in ACSF (at 6 mA stimulation intensity). B, Summary data obtained from experiments similar to those in A. Note that the amplitude of the population spike in slices from head-injured animals is larger than controls, indicating the presence of post-traumatic hyperexcitability. C, The resting [K +]o in the granule cell layer from the same slices as in B was not increased 1 week after head trauma. D, There was also no increase in the resting [K +]o 2 d and 1 month after injury. E, Resting [K +]o in the granule cell layer in 20 μm BMI and 20 μm AP-5 was not different between head-injured and control animals 1 week after FPI. [Inset, Similar results were obtained in 100 μm picrotoxin (Ptx) and 20 μm AP-5.]
Figure 2.
Figure 2.
Absence of postinjury decrease in the rate of clearance of tetanic stimulation-evoked [K +]o increase. A, Representative recordings of [K +]o in the granule cell layer evoked by tetanic stimulation of the perforant path at 8 mA stimulation intensity (for 5 sec at 100 Hz) reveal a larger [K +]o elevation 1 week after trauma (FPI) compared with controls (CON) (the y-axis shows [K +]o elevation above resting [K +]o on a Nernstian scale). B, Summary of data demonstrate an increase in the amplitude of the evoked [K +]o transient (above the resting [K +]o) after head injury. The asterisk indicates significance (Mann–Whitney U test). Inset, Summary plot showing that the single-shock, perforant path-evoked population spike amplitude (at 8 mA simulation intensity), from the same slices as in B, was larger after head trauma. C, The half-time of recovery of the tetanus-evoked [K +]o increase was not prolonged in slices from head-injured animals.
Figure 8.
Figure 8.
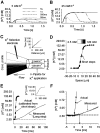
Detection of rapid changes in potassium concentration by ISMEs. Representative traces obtained by applying ACSF containing 5 mm (A) or 25 mm (B) potassium for increasing durations (50 msec, 500 msec, 1 sec, and 5 sec)show that brief changes in [K +]o lasting <500 msec can be detected by ISMEs. C, A schematic of the experimental setup for fast application switch from normal (2.5 mm, white) to high (120 mm, black) potassium concentration is shown. Inset, Regression fit shows the linear time distance profile for the stepping motor operating at 3 μm/msec [see Appendix (available at www.jneurosci.org) for details]. D, Spatial profile of the potassium concentration is shown in the narrow (20μm) interface region between the 2.5 mm and 120 mm potassium flow. Zero on thex-axis indicates the start of the interface region. E, Overlay of the actual and the measured [K +] during the long (i.e., uninterrupted) step from normal to high [K +] across the liquid interface is shown. The trace with circles is the actual K + concentration outside the electrode tip calculated from the spatial concentration profile of the flow (in D) and the speed of the fast application switch (3μm/msec). The line trace is what the electrode measured during the long step across the liquid interface normal to high [K +]. The inset shows that the electrode correctly measured the change in concentration during prolonged application of 120 mm potassium. F, The first 15 msec of the plots in E shows that a 0.08 mm (equivalent to 0.75 mV) change in [K +]o can be detected in <4 msec. The top dashed line indicates the threshold level of 0.08 mm increase in [K +]o, and the bottom dashed line indicates the steady-state [K +]o.
Figure 4.
Figure 4.
Faster rise and larger amplitude of evoked [K +]o increase 1 week after head trauma. A, Example traces of granule cell population spikes (top) evoked by perforant path stimulation (stimulation intensity, 2 mA) show the enhanced excitability in BMI (20 μm) and AP-5 (20 μm) after injury (FPI) compared with controls (CON). Representative [K +]o recordings at the same time scale as the field response (middle) and at a longer time scale (bottom) show a post-traumatic increase in the amplitude of the [K +]o transient (the scale for micromolar [K +]o increase is the same for the middle and bottom panels). B, Summary histogram demonstrate a greater evoked [K +]o increase after head injury, in response to low-frequency perforant path stimulation (at 2 mA). Inset, Summary data show that the presynaptic component of the [K +]o increase in the granule cell layer, evoked by a train of 10 stimuli (at 6 mA stimulation intensity) in slices recorded in the presence of ionotropic and metabotropic glutamate and GABA receptor antagonists, was not increased after head trauma. C, The exponential decay time constant of single-shock perforant path-evoked [K +]o transient was not prolonged in slices from head-injured animals. D, Summary bar graphs show the post-traumatic decrease in the latency to a 0.08 mm (0.75 mV) [K +]o elevation in response to low-frequency stimulation. Inset, Overlay of representative potassium electrode recordings from injured and control animals shows the faster rate of rise and shorter latency to detect a 0.08 mm increase in the evoked [K +]o elevation after head trauma. The horizontal line indicates a 0.08 mm increase in [K +]o (0.75 mV depolarization). Calibration bar, 40 msec. E, Histogram demonstrates the postinjury decrease in the rise time constant of the [K +]o transient. Inset, Summary data show the faster latency to onset of the population spike after head trauma.
Figure 5.
Figure 5.
Larger antidromically evoked [K +]o increase after head injury. A, Representative recordings of [K +]o transients in the granule cell layer evoked by antidromic stimulation at 6 mA (10 stimuli in 50 msec) show the larger [K +]o elevation in the fluid percussion head-injured animal (FPI) compared with the control (CON), in 20 μm BMI, 20 μm AP-5, and 10 μm CNQX (Δ[K +]o scale is exponential). Insets, Whole-cell recordings from granule cells in response to 10 stimuli (in 50 msec) show that each hilar stimulus evoked a single action potential in slices from both control and injured animals. Calibration: 20 mV, 10 msec. Recordings were obtained 1 week after head injury. B, Summary data similar to those in A are shown from slices from control animals (•) and FPI animals (○), in response to the increasing number of stimuli. Top inset, [K +]o increase (as a micromolar potassium concentration indicated on the y-axis) in slices from control animals (•) and FPI animals (○) animals, evoked by single-shock stimulation in the hilus (see Materials and Methods) at an increasing intensity (indicated on the x-axis in mA). Note that the response to a 6 mA stimulation shown in the inset is the same as the response to a single stimulus in B. Bottom inset, Histograms show the percentage change in the [K +]o elevation, evoked by a train of 10 stimuli (in 50 msec) to the hilus, when the perfusing medium was switched from 20μm BMI,20μm AP-5, and 10μm CNQXto100μm picrotoxin,20μm AP-5, and 10μm NBQX.C, Fast and slow exponential decay time constants of the antidromically evoked [K +]o transient were not different between head-injured and control animals 1 week after injury. Inset, The same data as in C, showing that the half-time of recovery of the evoked [K +]o increase was not prolonged after FPI. D, Half-time of recovery of the antidromic stimulation-evoked [K +]o transient 2 d and 1 month after FPI was not different from age-matched sham-controls.
Figure 6.
Figure 6.
Hyperexcitable granule cell field responses to antidromic stimulation. A, Examples of population spikes evoked by antidromic stimulation of the granule cells (at 6 mA stimulation intensity) in the same slices as in Figure 5A from an injured animal (FPI) and sham-control animal (CON) are shown. B, Summary data of the antidromic population spike amplitudes during the [K +]o recordings shown in the top inset in Figure 5B demonstrate an increase in the population spike amplitude 1 week after FPI. C, Summary plot shows that the half-width of the antidromically evoked population spike was decreased after head trauma.

Similar articles

Cited by

References

    1. Aitken PG, Somjen GG ( 1986) The sources of extracellular potassium accumulation in the CA1 region of hippocampal slices. Brain Res 369: 163-167. - PubMed
    1. Amzica F, Massimini M, Manfridi A ( 2002) Spatial buffering during slow and paroxysmal sleep oscillations in cortical networks of glial cells in vivo J Neurosci 22: 1042-1053. - PMC - PubMed
    1. Annegers JF, Coan SP ( 2000) The risks of epilepsy after traumatic brain injury. Seizure 9: 453-457. - PubMed
    1. Ballanyi K, Grafe P, Reddy MM, ten Bruggencate G ( 1984) Different types of potassium transport linked to carbachol and γ-aminobutyric acid actions in rat sympathetic neurons. Neuroscience 12: 917-927. - PubMed
    1. Bordey A, Sontheimer H ( 1998) Properties of human glial cells associated with epileptic seizure foci. Epilepsy Res 32: 286-303. - PubMed

Publication types

MeSH terms