. 2003 Aug 15;551(Pt 1):219-37.
doi: 10.1113/jphysiol.2003.040022. Epub 2003 Jul 4.

Effect of sarcoplasmic reticulum Ca2+ content on action potential-induced Ca2+ release in rat skeletal muscle fibres

Affiliations

Effect of sarcoplasmic reticulum Ca2+ content on action potential-induced Ca2+ release in rat skeletal muscle fibres

G S Posterino et al. J Physiol. .

Abstract

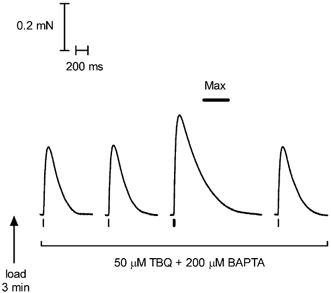
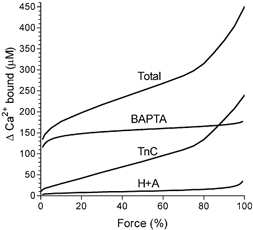
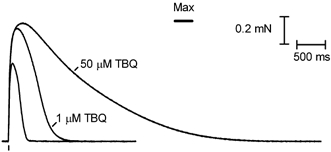
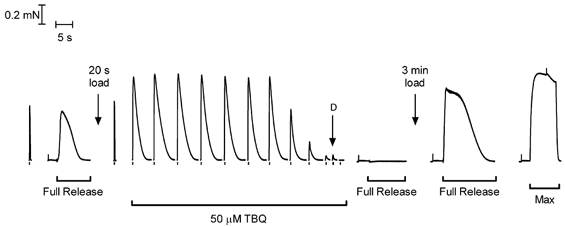
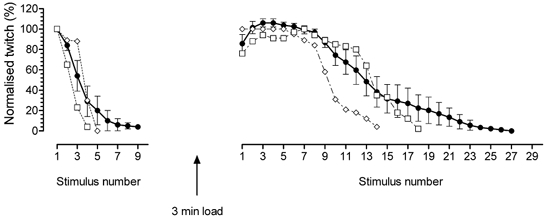
This study examined the relationship between the level of Ca2+ loading in the sarcoplasmic reticulum (SR) and the amount of Ca2+ released by an action potential (AP) in fast-twitch skeletal muscle fibres of the rat. Single muscle fibres were mechanically skinned and electric field stimulation was used to induce an AP in the transverse-tubular system and a resulting twitch response. Responses were elicited in the presence of known amounts (0-0.38 mM) of BAPTA, a fast Ca2+ buffer, with the SR Ca2+ pump either functional or blocked by 50 microM 2,5-di-tert-butyl-1,4-hydroquinone (TBQ). When Ca2+ reuptake was blocked, an estimate of the amount of Ca2+ released by an AP could be derived from the size of the force response. In a fibre with the SR loaded with Ca2+ at the endogenous level (approximately 1.2 mM, expressed as total Ca2+ per litre fibre volume; approximately one-third of maximal loading), a single AP triggered the release of approximately 230 microM Ca2+. If a second AP was elicited 10 ms after the first, only a further approximately 60 microM Ca2+ was released, the reduction probably being due to Ca2+ inactivation of Ca2+ release. When Ca2+ reuptake was blocked, APs applied 15 s apart elicited similar amounts of Ca2+ release (approximately 230 microM) on the first two or three occasions and then progressively less Ca2+ was released until the SR was fully depleted after a total of approximately eight APs. When the SR was loaded to near-maximal capacity (approximately 3-4 mM), each AP (or pair of APs 10 ms apart) still only released approximately the same amount of Ca2+ as that released when the fibre was endogenously loaded. Consistent with this, successive APs (15 s apart) elicited similar amounts of Ca2+ release approximately 10-16 times before the amount released declined, and the SR was fully depleted of Ca2+ after a total release calculated to be approximately 3-4 mM. When the SR was loaded maximally, increasing the [BAPTA] above 280 microM resulted in an increase in the amount of Ca2+ released per AP, probably because the greater level of cytoplasmic Ca2+ buffering prevented Ca2+ inactivation from adequately limiting Ca2+ release. These results show that the amount of Ca2+ released by AP stimulation in rat fast-twitch fibres normally stays virtually constant over a wide range of SR Ca2+ content, in spite of the likely large change in the electrochemical gradient for Ca2+. This was also found to be the case in toad twitch fibres. This constancy in Ca2+ release should help ensure precise regulation of force production in fast-twitch muscle in a range of circumstances.


Figures

Figure 8
Figure 8. Twitch response to a single AP or a pair of APs when initially loaded to maximal SR Ca2+ content
After the SR had been loaded to maximal capacity this skinned EDL fibre was stimulated by a single AP (first, second and fourth responses) or a pair of APs 10 ms apart (double stimulus; third response) in the presence of 50 μM TBQ and 200 μM BAPTA. As was the case in all 24 fibres examined in this way, the pair of APs elicited a substantially larger force response than a single AP, demonstrating that the force response under these conditions was indeed sensitive to the amount of Ca2+ released. The force response to the pair of APs was also less than the maximum Ca2+-activated force (Max) in this and all fibres examined. The response became smaller after ≈12 stimuli (not shown).
Figure 9
Figure 9. Force responses in a fibre stimulated by two APs at different intervals
Force responses in a rat EDL skinned fibre loaded to maximal capacity and stimulated in the presence of TBQ and 280 μM BAPTA by a single AP (S) or a pair of APs 10 ms, 80 ms or 440 ms apart (labelled D10, D80 and D440). Force responses are expressed relative to the maximum Ca2+-activated force and are shown superimposed, aligned with the first (or only) AP positioned at 0 ms. The vertical ticks indicate the timing of the APs. The various stimuli were applied at least 15 s apart (in the order D440, S, D10, D80). The fibre was first stimulated with the pair of APs spaced 440 ms apart (dashed line); the force response to the first AP of this pair elicited a slightly smaller force response (≈1 % of maximum) than did a single AP applied subsequently (≈2 % of maximum force, thin line S), but the peak force reached after the second AP of the pair was substantially higher than that reached with a pair of APs 10 ms apart (D10). When a pair of APs spaced 80 ms apart was applied, the peak force reached was even higher (D80). The total amount of Ca2+ released by the single or paired stimuli (calculated from the peak of the response) was 203 μM (S), 288 μM (D10), 311 μM (D80) and 301 μM (D440), though the latter two estimates are considerable underestimates owing to the evident loss of Ca2+ from the fibre (and binding to Ca2+-Mg2+ sites on TnC - see Methods) occurring over the interval between the first and second AP. If two APs applied in rapid succession (e.g. 10 ms apart) had released twice the amount of Ca2+ released by a single AP (i.e. 406 μM) it would have produced a force response between ≈85 and 95 % of maximum. The force responses in the figure can be reasonably accounted for by a model in which (1) Ca2+ is lost from the fibre with an exponential time constant of ≈600 ms, and (2) the amount of Ca2+ released by the second AP in a pair is reduced to ≈38 % of that released by the first for very short intervals (< 10 ms) and recovers with a time constant of ≈120 ms. Thus, if Δt is the time interval (in ms) between the two APs, the released Ca2+ (CaT) present in the fibre at the peak of the response to the second AP is calculated as CaT = 203 μM (et/600 + 0.38 + 0.62(1 - et/120)), which gives values of 287, 316 and 298 μM for the D10, D80 and D440 cases, respectively.
Figure 1
Figure 1. Relationship between force and Ca2+ binding used in calculations
The figure shows the relationship between the peak size of the force response to AP stimulation of a rat EDL fibre in the presence of 50 μM TBQ and 200 μM BAPTA (resting pCa 7.8) plotted against the increase in Ca2+ binding to various sites, calculated as described in Methods. The force response is expressed as a percentage of the maximum Ca2+-activated force in the same fibre. H+A denotes the curve giving the sum of the free [Ca2+] and the Ca2+ binding to ATP and a HDTA contaminant. The curve labelled Total shows the sum of the values indicated on the three lower curves. The increase in binding to BAPTA for other concentrations of BAPTA can be derived by appropriate scaling of the curve shown, taking into account that ≈25 μM of the BAPTA already has Ca2+ bound (see Methods).
Figure 3
Figure 3. Effect on twitch response of increasing SR Ca2+ content above endogenous level
The twitch response in a skinned EDL fibre to a single AP was measured when the SR initially contained only its endogenous Ca2+ level (control twitch, first trace). When the SR Ca2+ content was subsequently increased to ≈80-100 % of its maximal level (by loading the fibre for 1 min in a solution at pCa 6.7 with 1 mM total EGTA), the same stimulus elicited a force response that rose more rapidly than the control twitch (superimposed as dashed line) and reached maximal Ca2+-activated force (Max) before declining at a relatively slow rate. After the SR had been depleted of all Ca2+ (in the 30 mM caffeine-low [Mg2+] full release solution, see Methods) and then reloaded to approximately its endogenous level (by 20 s loading in pCa 6.7 solution), the twitch response was restored to near its initial level. All responses were elicited in standard solution (50 μM total EGTA, pCa 7.0).
Figure 4
Figure 4. Effect on twitch response of blocking the SR Ca2+ pump with TBQ
Superimposed twitch responses to a single AP stimulus when a fibre was bathed in the standard solution (50 μM total EGTA, pCa 7.0; smallest trace) or in the same solution with 1 μM TBQ (response shown is the sixth in TBQ, when the response had stabilised after 90 s exposure) or subsequently with 50 μM TBQ (applied for 30 s). The twitch response in 50 μM TBQ reached maximum Ca2+-activated force (Max) and took several seconds to decline.
Figure 2
Figure 2. Effect of Ca2+ buffering on the force response to single and paired APs
A mechanically skinned fibre from a rat EDL muscle was stimulated by either a single transverse electrical field pulse (70 V cm−1, 2 ms) or a pair of such pulses 10 ms apart (double stimulus) in the presence of various concentrations of Ca2+ buffers, and the resulting twitch force recorded. The bathing solution in the control conditions was the standard K-HDTA solution containing 50 μM total EGTA (pCa 7.0) and the SR contained its endogenous level of Ca2+. Where indicated, the fibre was transferred to a solution with either 200 μM additional EGTA (pCa ≈7.8) or 160 μM additional BAPTA (pCa ≈7.7) for 15 s and subjected to a single or double stimulus once before being returned to the standard solution. The level of maximum Ca2+-activated force (measured in 50 mM Ca-EGTA, pCa 4.7; see Methods) is indicated as Max. The timing of the stimuli is indicated by small ticks under the force responses.
Figure 5
Figure 5. Repeated stimulation in TBQ fully depletes the SR of Ca2+
After ascertaining the twitch response in a rat EDL fibre under the standard conditions (50 μM EGTA, pCa 7.0, no TBQ; left-most response), a relative measure of SR Ca2+ content was obtained from the area of the force response when fully depleting the SR of Ca2+ by exposing the fibre to a caffeine-low [Mg2+] solution (full release solution, see Methods). The SR was then reloaded with Ca2+ to approximately the same level (by 20 s in a solution at pCa 6.7, 1 mM EGTA) and the twitch response (in standard conditions) was similar to the initial such response. The fibre was then equilibrated in a matching solution with 50 μM TBQ for 30 s and stimulated every ≈15 s (single stimuli; note breaks in time axis) until the twitch response declined to < 10 % of its initial level. Stimulating the fibre with a double pulse (‘D’, pulses 10 ms apart) elicited a response similar to that with a single stimulus, and exposing the fibre immediately afterwards to the full release solution did not evoke any force response, indicating the SR contained little if any releasable Ca2+. After removal of TBQ and reloading the SR for 3 min, exposure to the full release solution evoked a large, prolonged response, showing the SR had been loaded well above the endogenous level. Lastly, maximum Ca2+-activated force was determined by exposing the fibre to the 50 mM Ca-EGTA solution (pCa 4.7, Max).
Figure 6
Figure 6. Repeated twitch responses in TBQ-BAPTA when starting with endogenous or maximal SR Ca2+ content
A twitch response was elicited under standard conditions (left-most trace) in a skinned EDL fibre initially containing only the endogenous SR Ca2+ content, and then the fibre was equilibrated for 30 s in a matching solution with 200 μM BAPTA and 50 μM TBQ and stimulated by single pulses every 15 s, eliciting progressively smaller responses, with the fourth being barely detectable. No response was elicited when exposing the fibre to a solution with low free [Mg2+] (0.05 mM, 50 μM EGTA, pCa 7.0; BAPTA removed beforehand by 10 s wash in standard solution), indicating the SR was relatively depleted of Ca2+. Following removal of TBQ and loading of the SR to maximal capacity (3 min in pCa 6.7 solution), many similar twitch responses could be elicited in the presence of the TBQ-BAPTA solution before the response size decreased. Note that despite loading the SR to maximal capacity, the twitch responses in TBQ-BAPTA (i.e. first 12) were similar in size to the first twitch response in TBQ-BAPTA with endogenous SR Ca2+ content. Finally, when the SR was reloaded with Ca2+ (to approximately the endogenous level; 20 s load in pCa 6.7 solution) the twitch response under standard conditions was restored to close to its initial level, showing that coupling was still functional and the SR contained Ca2+, and then lowering the [Mg2+] did elicit a large force response. Max indicates maximum Ca2+-activated force.
Figure 7
Figure 7. Summary of twitch responses in TBQ-BAPTA for endogenous and maximal Ca2+ content
The relative twitch responses in 50 μM TBQ-200 μM BAPTA for the fibre in Fig. 6 are shown (□), together with those of another fibre (⋄) that was also examined with both the endogenous (left panel) and maximal SR Ca2+ content (right panel). Responses in each fibre were normalised to the first response in TBQ-BAPTA with the endogenous Ca2+ content. Also shown is the mean (± S.E.M.) response (•) in all six fibres that initially had the endogenous Ca2+ content and were stimulated repetitively by a single AP in 50 μM TBQ-200 μM BAPTA until fully depleted, and all seven fibres that were loaded to maximal Ca2+ content and similarly stimulated until fully depleted. In the latter, the matching response with endogenous Ca2+ content was not obtained in every case, and so the responses in each fibre were expressed relative to the peak response and then the overall mean response across fibres was re-scaled so that the peak was of the same relative size as that found in the 13 fibres where both the first response with endogenous SR content and the peak response with maximal content were measured (see Table 2). All stimuli were single pulses. When starting with the SR loaded to maximum capacity, ≈8-16 similar responses could be elicited in each fibre before the response substantially decreased. Note that one effect of averaging across fibres is that the mean response declines less steeply on successive stimuli than was the case in individual fibres.
Figure 10
Figure 10. Amount of Ca2+ released by an AP over the full range of SR Ca2+ content
A, EDL fibres that were fully depleted of SR Ca2+ by repeated single AP stimuli in the presence of TBQ only (no BAPTA; e.g. Fig. 5) were used to examine the amount of Ca2+ released by an AP at low Ca2+ content. In each fibre the stimulus where the force response first failed to reach 10 % of maximum Ca2+-activated force was determined (defined as ‘1′), and used to align responses in the different fibres (n = 8). The mean (± S.E.M.) across the fibres for this response and for each of the preceding five responses (numbered 2-6) is shown. B, amount of Ca2+ released by the AP on each of the last six repetitions, calculated from the mean force responses in A (see Methods), and plotted against the cumulative total of released Ca2+ plus 20 μM (the latter added to take into account Ca2+ released by stimuli producing less than 10 % of maximum force). This abscissa scale can also be taken as the SR Ca2+ content at the time of each response. C, amount of Ca2+ released by each AP versus SR Ca2+ content for the fibre shown in Fig. 6. The SR content is calculated as the sum of the Ca2+ released by all subsequent stimuli plus the amount indicated in B as present in the SR (≈500 μM) when the release per AP had fallen to the minimum detectable level (≈135 μM) with 200 μM BAPTA present (see Fig. 1). ○, starting with maximal SR content; □, starting with endogenous SR content; *data from B.

Similar articles

Cited by

References

    1. Allen DG, Westerblad H. Role of phosphate and calcium stores in muscle fatigue. J Physiol. 2001;536:657–665. - PMC - PubMed
    1. Bakker AJ, Lamb GD, Stephenson DG. The effect of 2,5-di-(tert-butyl)-1,4-hydroquinone on force responses and the contractile apparatus in mechanically skinned muscle fibres of the rat and toad. J Muscle Res Cell Motil. 1996;17:55–67. - PubMed
    1. Baylor SM, Chandler WK, Marshall MW. Sarcoplasmic reticulum calcium release in frog skeletal muscle fibres from Arzenazo III calcium transients. J Physiol. 1983;344:625–666. - PMC - PubMed
    1. Baylor SM, Hollingworth S. Model of sarcoplasmic Ca2+ movements, including ATP Ca2+ binding and diffusion, during activation of frog skeletal muscle. J Gen Physiol. 1998;112:297–316. - PMC - PubMed
    1. Beard NA, Sakowska MM, Dulhunty AF, Laver DR. Calsequestrin is an inhibitor of skeletal muscle ryanodine receptor calcium release channels. Biophys J. 2002;82:310–320. - PMC - PubMed

Publication types

LinkOut - more resources