. 2003 Aug 1;550(Pt 3):829-44.
doi: 10.1113/jphysiol.2003.042176. Epub 2003 Jul 4.

Electrical coupling between the myenteric interstitial cells of Cajal and adjacent muscle layers in the guinea-pig gastric antrum

Affiliations

Electrical coupling between the myenteric interstitial cells of Cajal and adjacent muscle layers in the guinea-pig gastric antrum

H M Cousins et al. J Physiol. .

Abstract

Intracellular recordings were made from short segments of the muscular wall of the guinea-pig gastric antrum. Preparations were impaled using two independent microelectrodes, one positioned in the circular layer and the other either in the longitudinal layer, in the network of myenteric interstitial cells of Cajal (ICCMY) or in the circular layer. Cells in each layer displayed characteristic patterns of rhythmical activity, with the largest signals being generated by ICCMY. Current pulses injected into the circular muscle layer produced electrotonic potentials in each cell layer, indicating that the layers are electrically interconnected. The amplitudes of these electrotonic potentials were largest in the circular layer and smallest in the longitudinal layer. An analysis of electrical coupling between the three layers suggests that although the cells in each layer are well coupled to neighbouring cells, the coupling between either muscle layer and the network of ICCMY is relatively poor. The electrical connections between ICCMY and the circular layer did not rectify. In parallel immunohistochemical studies, the distribution of the connexins Cx40, Cx43 and Cx45 within the antral wall was determined. Only Cx43 was detected; it was widely distributed on ICCMY and throughout the circular smooth muscle layer, being concentrated around ICCIM, but was less abundant in the circular muscle layer immediately adjacent to ICCMY. Although the electrophysiological studies indicate that smooth muscle cells in the longitudinal muscle layer are electrically coupled to each other, none of the connexins examined were detected in this layer.


Figures

Figure 1
Figure 1. Equivalent electrical circuit of a short segment of the muscular wall of the gastric antrum
A, a schematic representation of a small segment of antral wall comprising a layer of circular smooth muscle, which includes some ICCIM, connected via a resistive pathway (RC-IC) to the ICCmy layer. On the right of the panel, a layer of longitudinal smooth muscle is also connected to the ICCmy layer via a resistive pathway (RL-IC). B, the equivalent electrical circuit describing current injection (I) into a circular muscle cell. Shown are equivalent resistors for the circular layer (RC), the ICCmy layer (RICC) and the longitudinal layer (RL). Access resistances connecting the ICCmy to the muscle layers are shown as RC-IC to the circular muscle layer and RL-IC, to the longitudinal muscle layer. Steady-state voltages arising in response to current injection, V1, V2 and V3, are marked at the circular, ICCmy and longitudinal layers. Also shown are pacemaking elements, RICC-Pacemaker and EPacemaker, but these are disconnected to simulate baseline conditions; their connecting switch is shown open. C, the equivalent circuit describing the state during spontaneous depolarization of the ICCmy layer in the absence of current injection. In this case, depolarization (V5) occurs because the switch is closed, mimicking the peak of a pacemaker potential. RICC-Pacemaker represents the increase in ICCmy membrane conductance that provides the pacemaker current shunt, and EPacemaker represents the equilibrium potential for the pacemaker current.
Figure 2
Figure 2. Paired intracellular recordings from different cells lying in the gastric antrum
A, a record from a circular muscle cell and a simultaneous record of smaller amplitude from a longitudinal muscle cell. Aa, part of the same record (indicated by a bar labelled a beneath the record) on an expanded time base. B, a record from a circular muscle cell and a simultaneous record of larger amplitude from an ICCmy. Ba, the indicated part of the same record on an expanded time base. C, two simultaneous records from two independently impaled circular muscle cells. Ca, the indicated part of the same record on an expanded time base. The voltage and time calibration bars apply to all traces. The membrane potentials of the circular smooth muscle layer, ICCmy and longitudinal layer were −62, −63 and −60 mV, respectively.
Figure 5
Figure 5. Calculation of coupling resistances between the ICCmy, longitudinal and circular muscle layers
Aa, slow waves recorded simultaneously from two different points in the circular muscle layer. Ab, the waveforms 3 min after caffeine (1 mm) was added to the solution. Note that while the regenerative component of the slow wave was reduced, the amplitude of the initial component was little altered. Ac, the average of 20 electrotonic potential responses to current (5 nA, Ad) injected into the circular muscle layer. B, a slow wave recorded from the a circular muscle cell, and a pacemaker potential recorded from ICCmy, in control conditions (a) and in the presence of caffeine (b). C, simultaneous recordings of a follower potential and a slow wave in control conditions (a) and in the presence of caffeine (b), recorded from the circular and longitudinal muscle layers, respectively. Examples of steady-state membrane potentials V1-V5 are illustrated in panels Ac, Bc, Cc and Bb, respectively. The voltage and current calibration bars apply to all traces. The membrane potentials of the circular smooth muscle layer, ICCmy and longitudinal layer were −64, −65 and −59 mV, respectively.
Figure 6
Figure 6. Asymmetrical membrane potential changes recorded from different cell types during the pacemaker cycle
A, the equivalent circuit for a small segment of antral wall. The circular muscle layer is shown as a variable resistor (RC), initially being allotted the same value as the longitudinal muscle layer (RL; 9.3 MΩ). This simulation illustrates the difference between a symmetrically loaded ICCmy layer and a more realistic asymmetrically loaded one. Ba, a slow wave with an initial component of about 12 mV; the amplitude of the initial component, which was determined in the presence of caffeine, is shown as a dotted line. Bb, a 40 mV pacemaker potential recorded in the ICCmy layer, which generated the initial component of the slow wave shown in Ba. Bc, a follower potential recorded in the longitudinal muscle layer. C, simulations of slow waves (Ca), pacemaker potentials (Cb) and follower potentials (Cc) for four different values of RC (equal to RL, RL/2, RL/4 and RL/8; i.e. 9.3, 4.6, 2.3 and 1.2 MΩ, respectively). Note that large changes in RC result in moderate changes to the amplitude of the initial component of the slow wave and negligible changes to the amplitudes of the pacemaker potential and the follower potential. The membrane potentials of the circular smooth muscle layer, ICCmy and longitudinal layer were −64, −64 and −65 mV, respectively.
Figure 7
Figure 7. Electrical isolation of cell layers during a slow wave arises from changes in the membrane resistance of ICCmy during each pacemaker potential
A, a successive pair of follower potentials. During the interval between slow waves, a current pulse (C) injected into the circular muscle layer (slow waves, B) generates an electrotonic potential in the longitudinal muscle layer. When the same current is injected near the peak of the slow wave, little or no electrotonic transmission is evident in the longitudinal layer. The voltage calibration bar applies to traces A and B. The time calibration bar applies to all traces. The membrane potentials of the circular smooth muscle layer and longitudinal layer were −62 and −61 mV, respectively. The apparent isolation of muscle cell layers during a slow wave can be explained if the membrane resistance of ICCmy fell to a low value during the plateau component of each pacemaker potential. Da, the amplitude of the electrotonic response in longitudinal muscle as a function of pacemaker shunt resistance (RICC-Pacemaker, see Fig. 1). Injected current (I) was 5 nA and the values of RC, RC-IC, RICC, RL-IC and RL were 2, 3.3, 12.3, 3.3 and 9.3 MΩ, respectively, as before. Db, the amplitude of the electrotonic response in the ICCmy layer as a function of RICC-Pacemaker. Dc, the amplitude of the pacemaker potential itself in the absence of injected current as a function of pacemaker shunt resistance.
Figure 3
Figure 3. Electrical coupling between the three cell layers of the gastric antrum and the lack of rectification between ICCmy and the circular muscle layer of the gastric antrum
Aa, electrotonic potentials recorded from the longitudinal, ICCmy and circular layer, each produced by injecting current (Ab) into the circular layer in the interval between slow waves. In this experiment the membrane potentials of the circular smooth muscle layer, ICCmy and longitudinal layer were −64, −63 and −62 mV, respectively. B, a family of electrotonic potentials (Ba) recorded from an ICCmy generated by injection of hyperpolarizing and depolarizing currents (Bb) into a circular muscle cell. Bc, the relationship between injected current and membrane potential response was close to linear (see text). The membrane potentials of the circular smooth muscle layer and ICCmy were −67 and −66 mV, respectively. The time bars apply to all traces.
Figure 4
Figure 4. Variability in electrical coupling between ICCmy and the circular muscle layer in different preparations
A, superimposed simultaneous membrane potential traces recorded from an ICCmy and a circular muscle cell (smaller amplitude trace). Note the modest initial component of the slow wave. B, electrotonic potentials recorded from ICCmy (a) and circular muscle (b) in response to current (c) injected into the circular muscle layer: the membrane potentials of the circular smooth muscle layer and ICCmy were −60 and −62 mV, respectively. C, superimposed simultaneous membrane potential traces recorded from a different bundle obtained from the same animal. Note the large initial component of the slow wave. D, electrotonic potentials recorded from ICCmy (a) and circular muscle (b) in response to current (c) injected into the circular muscle layer: the membrane potentials of the circular smooth muscle layer and ICCmy were −63 and −63 mV, respectively. The voltage and current calibration bars apply to all traces. E, relationship between the coupling ratio (see text) and the amplitude of the initial component of the slow wave, together with a straight-line fit.
Figure 8
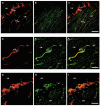
Figure 8. Distribution of Kit immunoreactivity and Cx43 immunoreactivity in muscular wall of the gastric antrum
A, B and C, a Z-stack of a transverse cryosections of the guinea-pig antrum immunostained for the Kit receptor, Cx43 and a merged image of A and B, respectively. A, immunopositive deposits in the myenteric region in ICCmy and on ICCIM within the circular smooth muscle layer. A few deposits are also found in the longitudinal muscle layer (LM). B, Cx43 staining in the circular smooth muscle layer and on both ICCmy and ICCIM. The Cx43 immunostaining appears as dots arranged in lines along the surface of the longitudinally sectioned circular smooth muscle cells (CM). No Cx43 staining was apparent in the longitudinal smooth muscle layer except in regions where Kit immunoreactivity was detected. C, regions of colocalization of Kit with Cx43 are labelled yellow. Scale bar = 10 μm. D, E and F, a Z-stack of an isolated ICCIM in the surrounding circular muscle immunostained for Kit, Cx43 and a merged image of D and E, respectively. Note that the density of Cx43 immunostaining is significantly greater on the ICCIM compared with the circular smooth muscle (E and F). Scale bar = 50 μm. G, H and I, high-power images of a Z-stack illustrating a layer of ICCmy and adjacent circular smooth muscle immunolabelled for Kit, Cx43 and the merged image of G and H, respectively. Cx43 staining is present in both ICCmy and in the circular smooth muscle. Note that there is a region that is obviously devoid of Cx43 immunostaining in the circular muscle immediately adjacent to the ICCmy (*). Scale bar = 50 μm (AC) or 10 μm (DI).

References

    1. Bolton TB. The depolarizing action of acetylcholine or carbachol in intestinal smooth muscle. J Physiol. 1972;220:647–671. - PMC - PubMed
    1. Burns AJ, Herbert TM, Ward SM, Sanders KM. Interstitial cells of Cajal in the guinea-pig gastrointestinal tract as revealed by c-Kit. Cell Tissue Res. 1997;290:11–20. - PubMed
    1. Burns AJ, Lomax AE, Torihashi S, Sanders KM, Ward SM. Interstitial cells of Cajal mediate inhibitory neurotransmission in the stomach. Proc Nat Acad Sci U S A. 1996;93:12008–12013. - PMC - PubMed
    1. Coppen SR, Dupont E, Rothery S, Severs NJ. Connexin45 expression is preferentially associated with the ventricular conduction system in mouse and rat heart. Circ Res. 1998;82:232–243. - PubMed
    1. Cousins HM, Edwards FR, Hirst GDS, Wendt IR. Cholinergic neuromuscular transmission in the longitudinal muscle of the guinea-pig ileum. J Physiol. 1993;471:61–86. - PMC - PubMed

Publication types

MeSH terms

LinkOut - more resources