. 2003 Jun;202(6):495-502.
doi: 10.1046/j.1469-7580.2003.00185.x.

The distribution of Notch receptors and their ligands during articular cartilage development

Affiliations

The distribution of Notch receptors and their ligands during articular cartilage development

A J Hayes et al. J Anat. 2003 Jun.

Abstract

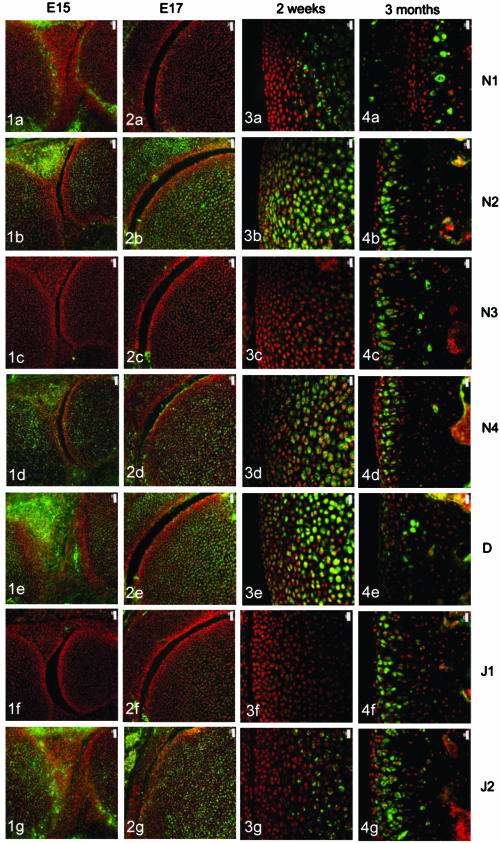
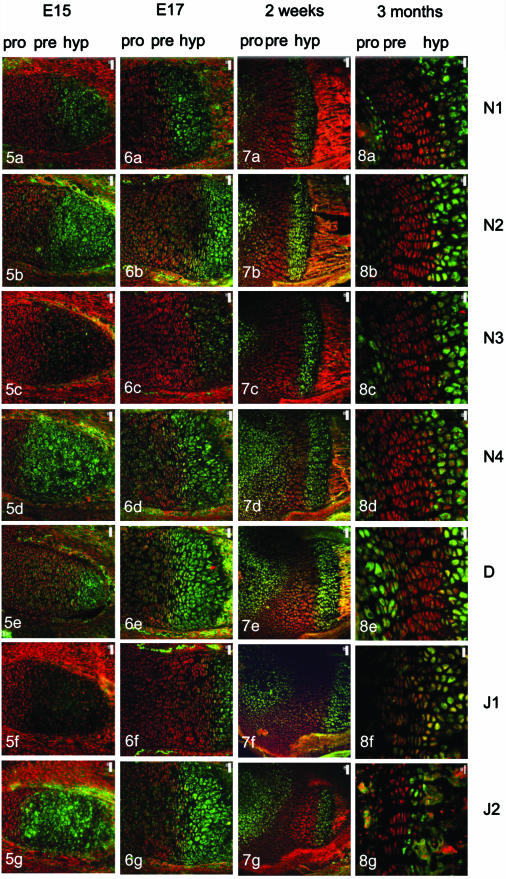
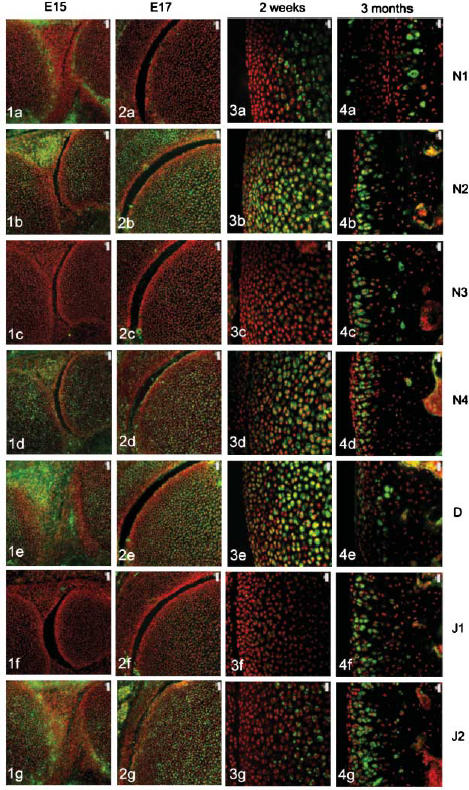
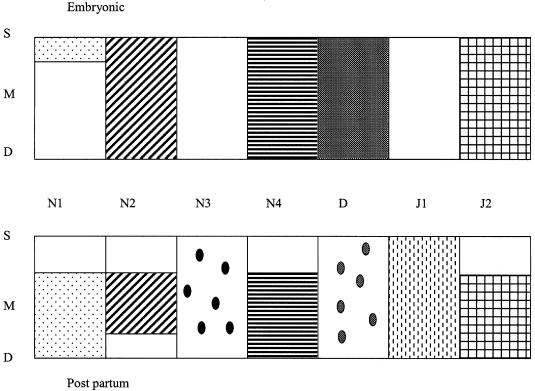
We examined the distribution of Notch family members and their ligands during the development of articular cartilage and the growth plate. Notch 1 was expressed by the chondrocytes of the developing articular surface but became increasingly restricted to the deeper layers after birth whilst expression of this family member was restricted to hypertrophic chondrocytes in the growth plate. Notch 2 and 4, Delta and Jagged 2 showed a broadly similar distribution, being present throughout the articular cartilage during development and becoming increasingly restricted to deeper layers with age. Hypertrophic chondrocytes within the growth plate also expressed Notch 2 and 4, Delta and Jagged 2 (which was also expressed in prehypertrophs). Notch 3 and Jagged 1 were absent from developing articular cartilage but were present in deeper layers at later time points (> 1 month) and both receptor and ligand were expressed in hypertrophic chondrocytes at all ages examined. These results highlight the complex Notch signalling interactions that result in the formation of the heterogeneous articular cartilage and allow for the co-ordinated ossification and elongation of the growth plate. Mechanisms by which these processes are controlled are discussed in light of recent advances in the understanding of Notch signalling pathways.


Figures

Fig. 1
Fig. 1
Notch family distribution in developing and growing mouse knee articular cartilage. Note the changes in expression pattern for individual family members with increasing age as outlined below. Notch 1 distribution was initially limited to the surfaces of the cavitating joint (Figs 1a and 2a) but became increasingly restricted to deeper layers with increasing age (Figs 3a and 4a). Notch 2 and Notch 4 expression were more widespread before birth (Figs 1b,d and 2b,d) but became increasingly restricted to deeper layers after birth (Figs 3b,d and 4b,d). Notch 3 was not expressed before birth (Figs 1c and 2c) but became increasingly expressed after birth except at the articular surface (Figs 3c and 4c). Delta and Jagged 2 were widely expressed before birth (Figs 1e,g and 2e,g) whereas Jagged 1 was only expressed in epiphyseal chondrocytes before birth (Fig. 2f). After birth, Delta and Jagged 2 became increasingly restricted to the deeper layers of the articular cartilage with the occasional chondrocyte in the surface layers labelling positively (Figs 3e,g and 4e,g). Jagged 1 was more widely expressed after birth (Figs 3f and 4f). Scale bars = 50 µm (Figs 1 and 2), and 20 µm (Figs 3 and 4).
Fig. 2
Fig. 2
Notch family distribution in developing and growing mouse knee articular cartilage. Note the changes in expression pattern for individual family members with increasing age as outlined below. Notch 1 distribution was initially limited to the surfaces of the cavitating joint (Figs 1a and 2a) but became increasingly restricted to deeper layers with increasing age (Figs 3a and 4a). Notch 2 and Notch 4 expression were more widespread before birth (Figs 1b,d and 2b,d) but became increasingly restricted to deeper layers after birth (Figs 3b,d and 4b,d). Notch 3 was not expressed before birth (Figs 1c and 2c) but became increasingly expressed after birth except at the articular surface (Figs 3c and 4c). Delta and Jagged 2 were widely expressed before birth (Figs 1e,g and 2e,g) whereas Jagged 1 was only expressed in epiphyseal chondrocytes before birth (Fig. 2f). After birth, Delta and Jagged 2 became increasingly restricted to the deeper layers of the articular cartilage with the occasional chondrocyte in the surface layers labelling positively (Figs 3e,g and 4e,g). Jagged 1 was more widely expressed after birth (Figs 3f and 4f). Scale bars = 50 µm (Figs 1 and 2), and 20 µm (Figs 3 and 4).
Fig. 3
Fig. 3
Notch family distribution in developing and growing mouse knee articular cartilage. Note the changes in expression pattern for individual family members with increasing age as outlined below. Notch 1 distribution was initially limited to the surfaces of the cavitating joint (Figs 1a and 2a) but became increasingly restricted to deeper layers with increasing age (Figs 3a and 4a). Notch 2 and Notch 4 expression were more widespread before birth (Figs 1b,d and 2b,d) but became increasingly restricted to deeper layers after birth (Figs 3b,d and 4b,d). Notch 3 was not expressed before birth (Figs 1c and 2c) but became increasingly expressed after birth except at the articular surface (Figs 3c and 4c). Delta and Jagged 2 were widely expressed before birth (Figs 1e,g and 2e,g) whereas Jagged 1 was only expressed in epiphyseal chondrocytes before birth (Fig. 2f). After birth, Delta and Jagged 2 became increasingly restricted to the deeper layers of the articular cartilage with the occasional chondrocyte in the surface layers labelling positively (Figs 3e,g and 4e,g). Jagged 1 was more widely expressed after birth (Figs 3f and 4f). Scale bars = 50 µm (Figs 1 and 2), and 20 µm (Figs 3 and 4).
Fig. 4
Fig. 4
Notch family distribution in developing and growing mouse knee articular cartilage. Note the changes in expression pattern for individual family members with increasing age as outlined below. Notch 1 distribution was initially limited to the surfaces of the cavitating joint (Figs 1a and 2a) but became increasingly restricted to deeper layers with increasing age (Figs 3a and 4a). Notch 2 and Notch 4 expression were more widespread before birth (Figs 1b,d and 2b,d) but became increasingly restricted to deeper layers after birth (Figs 3b,d and 4b,d). Notch 3 was not expressed before birth (Figs 1c and 2c) but became increasingly expressed after birth except at the articular surface (Figs 3c and 4c). Delta and Jagged 2 were widely expressed before birth (Figs 1e,g and 2e,g) whereas Jagged 1 was only expressed in epiphyseal chondrocytes before birth (Fig. 2f). After birth, Delta and Jagged 2 became increasingly restricted to the deeper layers of the articular cartilage with the occasional chondrocyte in the surface layers labelling positively (Figs 3e,g and 4e,g). Jagged 1 was more widely expressed after birth (Figs 3f and 4f). Scale bars = 50 µm (Figs 1 and 2), and 20 µm (Figs 3 and 4).
Fig. 5
Fig. 5
Notch family distribution in the developing mouse epiphyseal plate. All family members are expressed in the primary centre of ossification at E15 to varying degrees (Fig. 5a–g), for example Notch 2 is widespread (Fig. 5b) whereas Notch 3 is far more restricted (Fig. 5c). With increasing age and the development of the secondary centre of ossification, Notch family members exhibit diverse patterns of distribution. Notch 1 is restricted to hypertrophs initially (Fig. 6a) but by 2 weeks is expressed in hypertrophs and resting/proliferative cells (Figs 7a and 8a). Notch 2 and 4 are widespread throughout the growth plate prenatally but become restricted to hypertrophs with increasing age (Figs 6b,d, 7b,d and 8b,d) whilst Notch 3 remains restricted to hypertrophs (Figs 6c, 7c and 8c). The initial widespread distribution of Delta (Figs 5e and 6e) becomes more attenuated to hypertrophs and resting chondrocytes with age although some maturing cells express this ligand (Figs 5e, 6e, 7e and 8e). Jagged 1 was restricted to hypertrophic chondrocytes (Figs 6f, 7f and 8f) whereas Jagged 2 was more widespread but became restricted to hypertrophs by 3 months (Figs 6g, 7g and 8g). Delineation of prehypertrophic (pre) from proliferating (pro) and hypertrophic (hyp) chondrocytes is shown at top of columns.
Fig. 6
Fig. 6
Notch family distribution in the developing mouse epiphyseal plate. All family members are expressed in the primary centre of ossification at E15 to varying degrees (Fig. 5a–g), for example Notch 2 is widespread (Fig. 5b) whereas Notch 3 is far more restricted (Fig. 5c). With increasing age and the development of the secondary centre of ossification, Notch family members exhibit diverse patterns of distribution. Notch 1 is restricted to hypertrophs initially (Fig. 6a) but by 2 weeks is expressed in hypertrophs and resting/proliferative cells (Figs 7a and 8a). Notch 2 and 4 are widespread throughout the growth plate prenatally but become restricted to hypertrophs with increasing age (Figs 6b,d, 7b,d and 8b,d) whilst Notch 3 remains restricted to hypertrophs (Figs 6c, 7c and 8c). The initial widespread distribution of Delta (Figs 5e and 6e) becomes more attenuated to hypertrophs and resting chondrocytes with age although some maturing cells express this ligand (Figs 5e, 6e, 7e and 8e). Jagged 1 was restricted to hypertrophic chondrocytes (Figs 6f, 7f and 8f) whereas Jagged 2 was more widespread but became restricted to hypertrophs by 3 months (Figs 6g, 7g and 8g). Delineation of prehypertrophic (pre) from proliferating (pro) and hypertrophic (hyp) chondrocytes is shown at top of columns.
Fig. 7
Fig. 7
Notch family distribution in the developing mouse epiphyseal plate. All family members are expressed in the primary centre of ossification at E15 to varying degrees (Fig. 5a–g), for example Notch 2 is widespread (Fig. 5b) whereas Notch 3 is far more restricted (Fig. 5c). With increasing age and the development of the secondary centre of ossification, Notch family members exhibit diverse patterns of distribution. Notch 1 is restricted to hypertrophs initially (Fig. 6a) but by 2 weeks is expressed in hypertrophs and resting/proliferative cells (Figs 7a and 8a). Notch 2 and 4 are widespread throughout the growth plate prenatally but become restricted to hypertrophs with increasing age (Figs 6b,d, 7b,d and 8b,d) whilst Notch 3 remains restricted to hypertrophs (Figs 6c, 7c and 8c). The initial widespread distribution of Delta (Figs 5e and 6e) becomes more attenuated to hypertrophs and resting chondrocytes with age although some maturing cells express this ligand (Figs 5e, 6e, 7e and 8e). Jagged 1 was restricted to hypertrophic chondrocytes (Figs 6f, 7f and 8f) whereas Jagged 2 was more widespread but became restricted to hypertrophs by 3 months (Figs 6g, 7g and 8g). Delineation of prehypertrophic (pre) from proliferating (pro) and hypertrophic (hyp) chondrocytes is shown at top of columns.
Fig. 8
Fig. 8
Notch family distribution in the developing mouse epiphyseal plate. All family members are expressed in the primary centre of ossification at E15 to varying degrees (Fig. 5a–g), for example Notch 2 is widespread (Fig. 5b) whereas Notch 3 is far more restricted (Fig. 5c). With increasing age and the development of the secondary centre of ossification, Notch family members exhibit diverse patterns of distribution. Notch 1 is restricted to hypertrophs initially (Fig. 6a) but by 2 weeks is expressed in hypertrophs and resting/proliferative cells (Figs 7a and 8a). Notch 2 and 4 are widespread throughout the growth plate prenatally but become restricted to hypertrophs with increasing age (Figs 6b,d, 7b,d and 8b,d) whilst Notch 3 remains restricted to hypertrophs (Figs 6c, 7c and 8c). The initial widespread distribution of Delta (Figs 5e and 6e) becomes more attenuated to hypertrophs and resting chondrocytes with age although some maturing cells express this ligand (Figs 5e, 6e, 7e and 8e). Jagged 1 was restricted to hypertrophic chondrocytes (Figs 6f, 7f and 8f) whereas Jagged 2 was more widespread but became restricted to hypertrophs by 3 months (Figs 6g, 7g and 8g). Delineation of prehypertrophic (pre) from proliferating (pro) and hypertrophic (hyp) chondrocytes is shown at top of columns.
Fig. 9
Fig. 9
Summary of Notch family distribution in mouse articular cartilage before birth and at maturity (3 months). S, surface zone; M, middle zone; D, deep zone.

Similar articles

Cited by

References

    1. Archer CW, Morrison H, Pitsillides AA. Cellular aspects of the development of diarthrodial joints and articular cartilage. J. Anat. 1994;184:447–456. - PMC - PubMed
    1. Archer CW, Boyer S, Redman S, Bishop J, Dowthwaite GP. The identification and characterisation of articular cartilage progenitor cells. Trans. ORS. 2002;48:9.
    1. Artavanis-Tsakonas S, Matsuno K, Fortini ME. Notch signalling. Science. 1995;268:225–232. - PubMed
    1. Bayliss MT, Osborne D, Woodhouse S, Davidson C. Sulfation of chondroitin sulfate in human articular cartilage. The effect of age, topographical position and zone of cartilage on tissue composition. J. Biol. Chem. 1999;274:15892–15900. - PubMed
    1. Campos AH, Wang W, Pollman MJ, Gibbons GH. Determinants of notch-3 receptor expression and signalling in vascular smooth muscle cells: implications in cell cycle regulation. Circ. Res. 2002;29:999–1006. - PubMed

MeSH terms

LinkOut - more resources