. 2003 Jul 7;198(1):63-9.
doi: 10.1084/jem.20022125.

The programmed death-1 (PD-1) pathway regulates autoimmune diabetes in nonobese diabetic (NOD) mice

Affiliations

The programmed death-1 (PD-1) pathway regulates autoimmune diabetes in nonobese diabetic (NOD) mice

Mohammed Javeed I Ansari et al. J Exp Med. .

Abstract

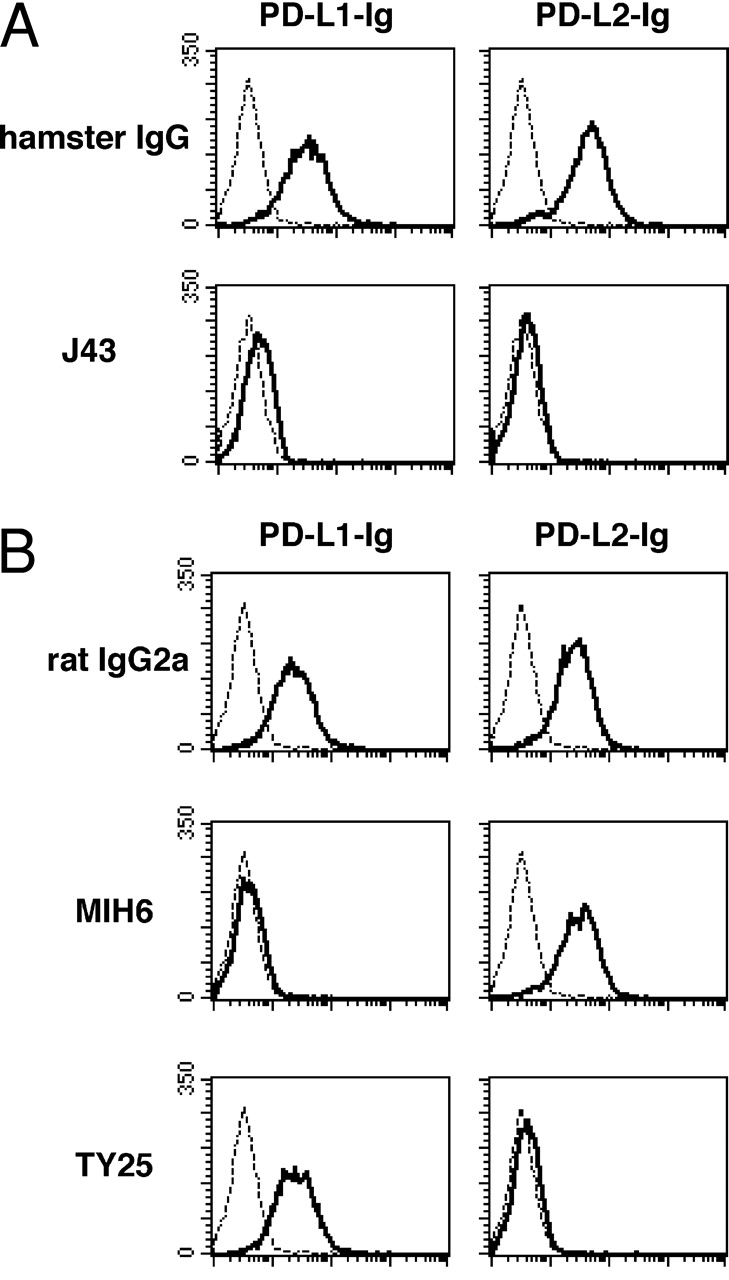
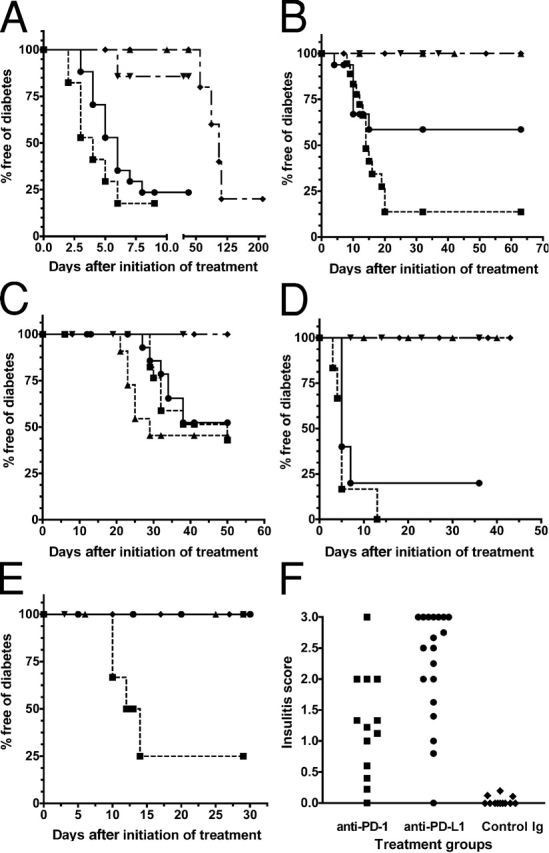
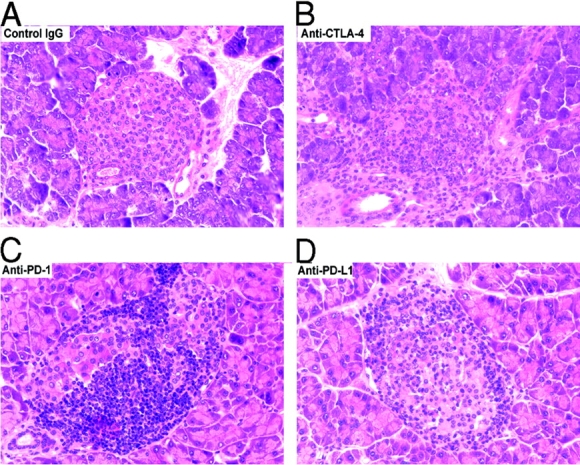
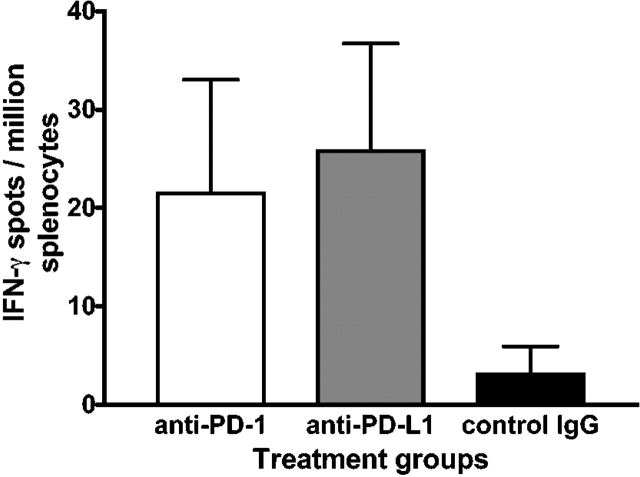
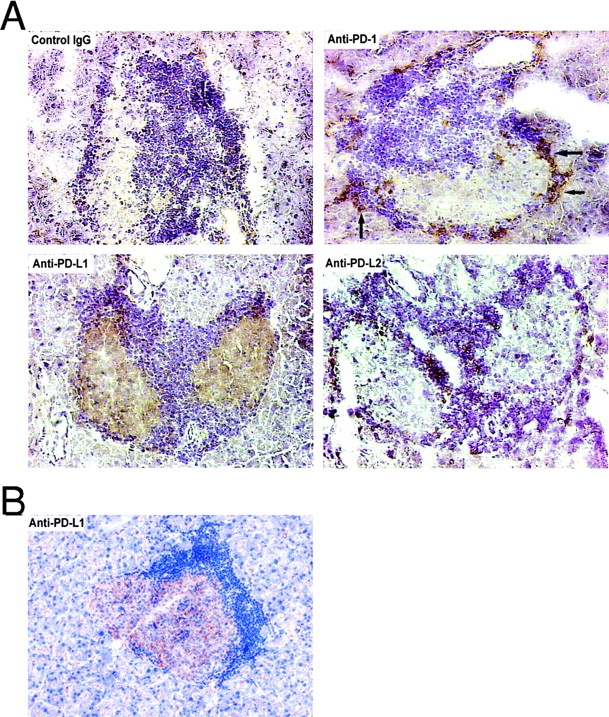
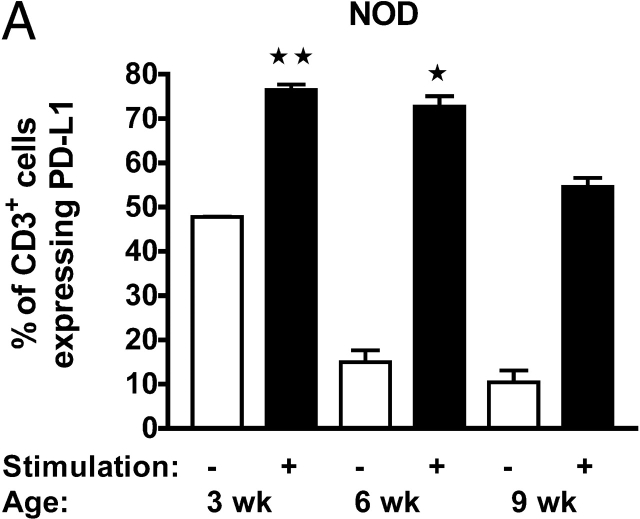
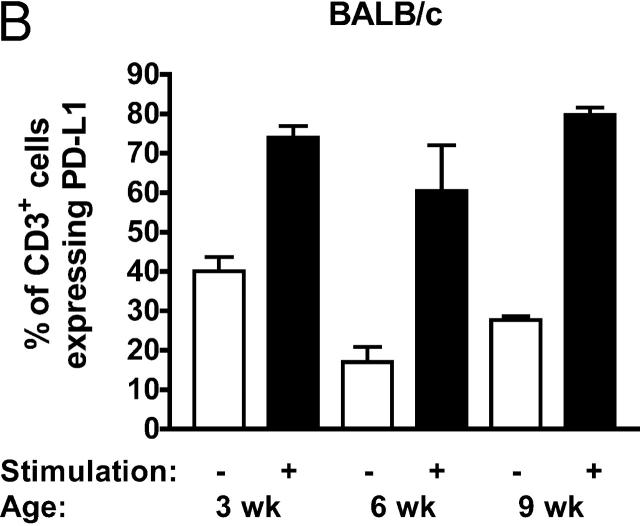
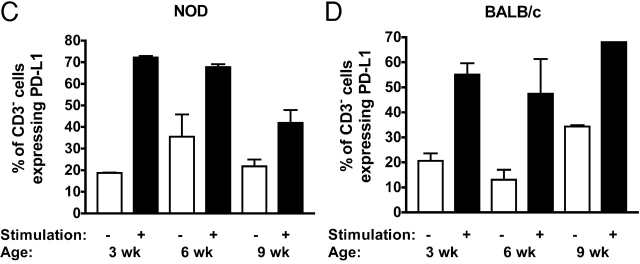
Programmed death-1 (PD-1) receptor, an inhibitory costimulatory molecule found on activated T cells, has been demonstrated to play a role in the regulation of immune responses and peripheral tolerance. We investigated the role of this pathway in the development of autoimmune diabetes. PD-1 or PD-L1 but not PD-L2 blockade rapidly precipitated diabetes in prediabetic female nonobese diabetic (NOD) mice regardless of age (from 1 to 10-wk-old), although it was most pronounced in the older mice. By contrast, cytotoxic T lymphocyte-associated antigen 4 (CTLA-4) blockade induced disease only in neonates. Male NOD mice also developed diabetes after PD-1-PD-L1 pathway blockade, but NOR mice, congenic to NOD but resistant to the development of diabetes, did not. Insulitis scores were significantly higher and frequency of interferon gamma-producing GAD-reactive splenocytes was increased after PD-1-PD-L1 pathway blockade compared with controls. Interestingly, PD-L1 but not PD-L2 was found to be expressed on inflamed islets of NOD mice. These data demonstrate a central role for PD-1-PD-L1 interaction in the regulation of induction and progression of autoimmune diabetes in the NOD mouse and provide the rationale to develop new therapies to target this costimulatory pathway in this disease.


Figures

Figure 1.
Figure 1.
Blocking properties of mAbs against PD-1, PD-L1, and PD-L2. (A) Anti–PD-1 (J43) inhibits binding of both PD-L1-Ig and PD-L2-Ig (bold lines) to PD-1 transfectants. Dashed lines indicate staining with control human IgG. (B) Anti–PD-L1 (MIH6) inhibits PD-L1-Ig binding and anti–PD-L2 (TY25) inhibits PD-L2-Ig binding to PD-1 transfectants (bold lines). Dashed lines indicate staining with control human IgG.
Figure 2.
Figure 2.
PD-1–PD-L1 blockade accelerates autoimmune diabetes in NOD mice. All p-values are for comparisons with respective controls. (A) Diabetes-free survival after PD-1–PD-L1 blockade in 10-wk-old female NOD mice: anti–PD-1 (•; n = 17; P < 0.0001), anti–PD-L1 (▪; n = 17; P < 0.0001), anti–PD-L2 (▾; n = 7; P = 0.1904), anti–CTLA-4 (▴; n = 6; P = NS), and control antibody (♦; n = 12) treatment. (B) Diabetes-free survival after PD-1–PD-L1 blockade in 4-wk-old female NOD mice: anti–PD-1 (•; n = 15; P < 0.0184), anti–PD-L1 (▪; n = 18; P < 0.0001), anti–PD-L2 (▾; n = 7; P = NS), anti–CTLA-4 (▴; n = 10; P = NS), and control antibody (♦; n = 12) treatment. (C) Diabetes-free survival after PD-1–PD-L1 blockade in 1-wk-old female NOD mice: anti–PD-1 (•; n = 18; P = 0.0071), anti–PD-L1 (▪; n = 18; P = 0.0018), anti–PD-L2 (▾; n = 11; P = NS), anti–CTLA-4 (▴; n = 11; P = 0.0016), and control antibody (♦; n = 10) treatment. (D) Diabetes-free survival after PD-1–PD-L1 blockade in 10-wk-old male NOD mice: anti–PD-1 (•; n = 5; P = 0.0126), anti–PD-L1 (▪; n = 5; P = 0.0126), and control antibody (♦; n = 5) treatment. In 10-wk-old female NOR mice: anti–PD-1 (▾; n = 5; P = NS) and anti–PD-L1 (▴; n = 5; P = NS) treatment. (E) Diabetes-free survival after PD-1–PD-L1 blockade in 4-wk-old male NOD mice: anti–PD-1 (•; n = 5; P = NS), anti–PD-L1 (▪; n = 6; P = 0.038), control Ig (♦; n = 5) treatment. In 4-wk-old female NOR mice: anti–PD-1 (▾; n = 5; P = NS) and anti–PD-L1 (▴; n = 6; P = NS) treatment. (F) Insulitis scores in 4–5-wk-old female NOD mice treated with anti–PD-1 (▪; mean score 1.249 ± 0.2349; P < 0.001), anti–PD-L1 (•; mean score 2.275 ± 0.1987; P < 0.001), and control IgG (♦; mean score 0.03634 ± 0.01987).
Figure 3.
Figure 3.
PD-1–PD-L1 and CTLA-4 blockade accelerates insulitis in prediabetic female NOD mice. (A) Islets from control IgG–treated mouse at 5 wk of age. (B–D) Inflamed islets from anti–CTLA-4, anti–PD-1, or anti–PD-L1 mAb-treated mice, respectively, at 5 wk of age (all stained with hematoxylin and eosin; ×400).
Figure 4.
Figure 4.
Increased frequency of IFN-γ–producing GAD-specific splenocytes in NOD mice treated with anti–PD- or anti–PD-L1 mAb. ELISPOT responses are expressed as number of IFN-γ spots per million splenocytes from anti–PD-1 mAb, anti–PD-L1 mAb, and control IgG–treated 4-wk-old female NOD mice.
Figure 5.
Figure 5.
(A) PD-L1 expression in inflamed islets of NOD mice and PD-1 expression on infiltrating cells. Inflamed islets from 10-wk-old unmanipulated prediabetic female NOD mice showing negative staining with isotype control Ig, positive PD-1 staining of infiltrating cells (arrows), positive PD-L1 staining of islets, and negative PD-L2 staining (×400). (B) Injected anti–PD-L1 mAb binds to islets. Inflamed islet, from a 10-wk-old NOD mouse that developed diabetes after injection of anti–PD-L1, showing positive direct staining with anti–rat antibody (×400).
Figure 6.
Figure 6.
PD-L1 expression is down-regulated on stimulated splenocytes of older NOD mice. Expression of PD-L1 on CD3+ (A and B) or CD3 (C and D) splenocytes of female NOD (A and C) or BALB/c (B and D) mice of various ages before and after stimulation with immobilized anti-CD3 mAb for 72 h. *, P < 0.01 and **, P < 0.05 versus stimulated CD3+ cells from 9-wk-old female NOD mice.
Figure 6.
Figure 6.
PD-L1 expression is down-regulated on stimulated splenocytes of older NOD mice. Expression of PD-L1 on CD3+ (A and B) or CD3 (C and D) splenocytes of female NOD (A and C) or BALB/c (B and D) mice of various ages before and after stimulation with immobilized anti-CD3 mAb for 72 h. *, P < 0.01 and **, P < 0.05 versus stimulated CD3+ cells from 9-wk-old female NOD mice.

References

    1. Van Parijs, L., and A.K. Abbas. 1998. Homeostasis and self-tolerance in the immune system: turning lymphocytes off. Science. 280:243–248. - PubMed
    1. Carreno, B.M., and M. Collins. 2002. The B7 family of ligands and its receptors: new pathways for costimulation and inhibition of immune responses. Annu. Rev. Immunol. 20:29–53. - PubMed
    1. Ishida, Y., Y. Agata, K. Shibahara, and T. Honjo. 1992. Induced expression of PD-1, a novel member of the immunoglobulin gene superfamily, upon programmed cell death. EMBO J. 11:3887–3895. - PMC - PubMed
    1. Agata, Y., A. Kawasaki, H. Nishimura, Y. Ishida, T. Tsubata, H. Yagita, and T. Honjo. 1996. Expression of the PD-1 antigen on the surface of stimulated mouse T and B lymphocytes. Int. Immunol. 8:765–772. - PubMed
    1. Freeman, G.J., A.J. Long, Y. Iwai, K. Bourque, T. Chernova, H. Nishimura, L.J. Fitz, N. Malenkovich, T. Okazaki, M.C. Byrne, et al. 2000. Engagement of the PD-1 immunoinhibitory receptor by a novel B7 family member leads to negative regulation of lymphocyte activation. J. Exp. Med. 192:1027–1034. - PMC - PubMed

Publication types

MeSH terms