

Critical role of the programmed death-1 (PD-1) pathway in regulation of experimental autoimmune encephalomyelitis
- PMID: 12847138
- PMCID: PMC2196082
- DOI: 10.1084/jem.20022119
Critical role of the programmed death-1 (PD-1) pathway in regulation of experimental autoimmune encephalomyelitis
Erratum in
- J Exp Med. 2003 Aug 18;198(4):677
Abstract
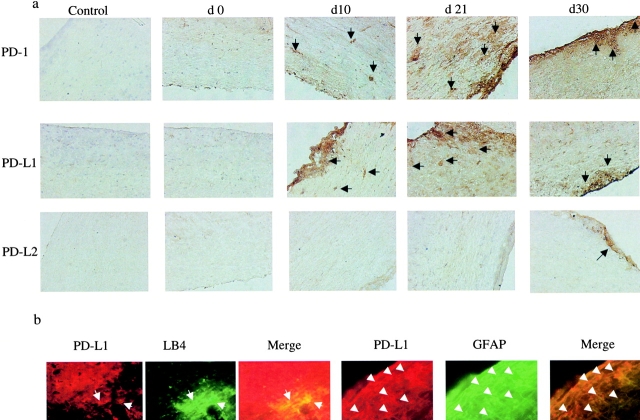
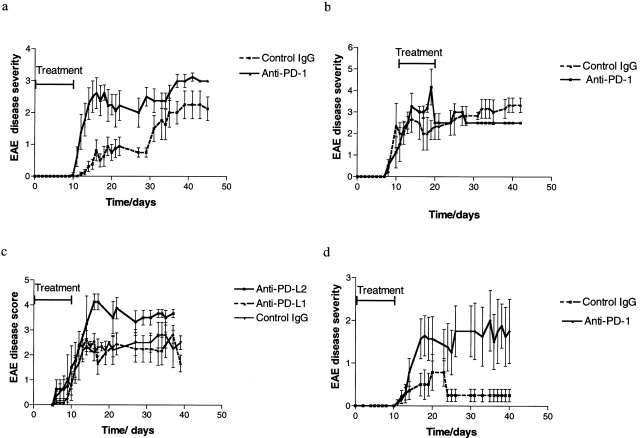
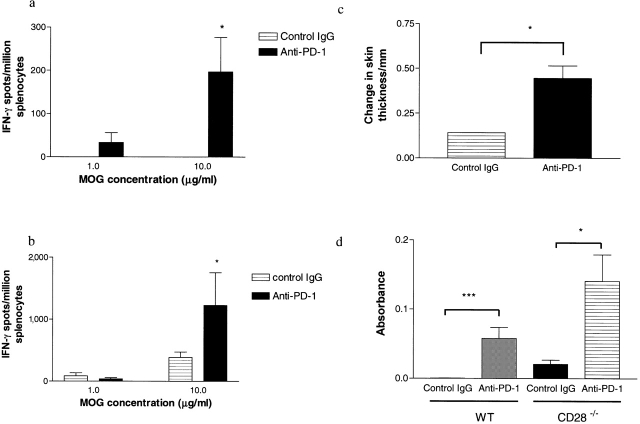
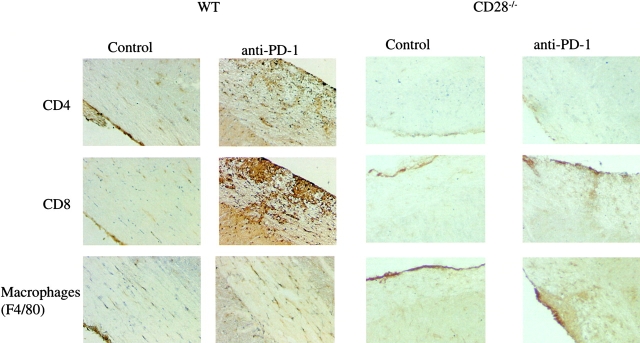
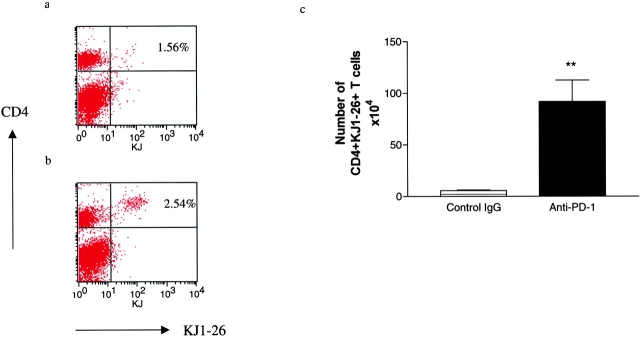
Experimental autoimmune encephalomyelitis (EAE) is mediated by autoantigen-specific T cells dependent on critical costimulatory signals for their full activation and regulation. We report that the programmed death-1 (PD-1) costimulatory pathway plays a critical role in regulating peripheral tolerance in murine EAE and appears to be a major contributor to the resistance of disease induction in CD28-deficient mice. After immunization with myelin oligodendrocyte glycoprotein (MOG) there was a progressive increase in expression of PD-1 and its ligand PD-L1 but not PD-L2 within the central nervous system (CNS) of mice with EAE, peaking after 3 wk. In both wild-type (WT) and CD28-deficient mice, PD-1 blockade resulted in accelerated and more severe disease with increased CNS lymphocyte infiltration. Worsening of disease after PD-1 blockade was associated with a heightened autoimmune response to MOG, manifested by increased frequency of interferon gamma-producing T cells, increased delayed-type hypersensitivity responses, and higher serum levels of anti-MOG antibody. In vivo blockade of PD-1 resulted in increased antigen-specific T cell expansion, activation, and cytokine production. Interestingly, PD-L2 but not PD-L1 blockade in WT animals also resulted in disease augmentation. Our data are the first demonstration that the PD-1 pathway plays a critical role in regulating EAE.
Figures
Similar articles
-
The programmed death-1 (PD-1) pathway regulates autoimmune diabetes in nonobese diabetic (NOD) mice.J Exp Med. 2003 Jul 7;198(1):63-9. doi: 10.1084/jem.20022125. J Exp Med. 2003. PMID: 12847137 Free PMC article.
-
Differential role of programmed death-ligand 1 [corrected] and programmed death-ligand 2 [corrected] in regulating the susceptibility and chronic progression of experimental autoimmune encephalomyelitis.J Immunol. 2006 Mar 15;176(6):3480-9. doi: 10.4049/jimmunol.176.6.3480. J Immunol. 2006. PMID: 16517716
-
PD-1/PD-L1, but not PD-1/PD-L2, interactions regulate the severity of experimental autoimmune encephalomyelitis.J Neuroimmunol. 2007 Jan;182(1-2):124-34. doi: 10.1016/j.jneuroim.2006.10.006. Epub 2006 Dec 19. J Neuroimmunol. 2007. PMID: 17182110
-
PD-1/PD-L pathway and autoimmunity.Autoimmunity. 2005 Aug;38(5):353-7. doi: 10.1080/08916930500124072. Autoimmunity. 2005. PMID: 16227150 Review.
-
Novel strategies for inhibiting PD-1 pathway-mediated immune suppression while simultaneously delivering activating signals to tumor-reactive T cells.Cancer Immunol Immunother. 2015 Oct;64(10):1287-93. doi: 10.1007/s00262-015-1677-5. Epub 2015 Mar 20. Cancer Immunol Immunother. 2015. PMID: 25792524 Free PMC article. Review.
Cited by
-
Tolerance of activated pathogenic CD4+ T cells by transcriptional targeting of dendritic cells.Gene Ther. 2015 May;22(5):382-90. doi: 10.1038/gt.2015.6. Epub 2015 Mar 5. Gene Ther. 2015. PMID: 25739989
-
Maturation of circulating Ly6ChiCCR2+ monocytes by mannan-MOG induces antigen-specific tolerance and reverses autoimmune encephalomyelitis.Front Immunol. 2022 Sep 9;13:972003. doi: 10.3389/fimmu.2022.972003. eCollection 2022. Front Immunol. 2022. PMID: 36159850 Free PMC article.
-
PD-L1(hi) retinal pigment epithelium (RPE) cells elicited by inflammatory cytokines induce regulatory activity in uveitogenic T cells.J Leukoc Biol. 2010 Dec;88(6):1241-9. doi: 10.1189/jlb.0610332. Epub 2010 Aug 25. J Leukoc Biol. 2010. PMID: 20739617 Free PMC article.
-
PD-1/PD-L Axis in Neuroinflammation: New Insights.Front Neurol. 2022 Jun 9;13:877936. doi: 10.3389/fneur.2022.877936. eCollection 2022. Front Neurol. 2022. PMID: 35756927 Free PMC article. Review.
-
Macrophage galactose-type lectin (MGL) is induced on M2 microglia and participates in the resolution phase of autoimmune neuroinflammation.J Neuroinflammation. 2019 Jun 27;16(1):130. doi: 10.1186/s12974-019-1522-4. J Neuroinflammation. 2019. PMID: 31248427 Free PMC article.
References
-
- Begolka, W.S., C.L. Vanderlugt, S.M. Rahbe, and S.D. Miller. 1998. Differential expression of inflammatory cytokines parallels progression of central nervous system pathology in two clinically distinct models of multiple sclerosis. J. Immunol. 161:4437–4446. - PubMed
-
- Miller, S.D., C.L. Vanderlugt, D.J. Lenschow, J.G. Pope, N.J. Karandikar, M.C. Dal Canto, and J.A. Bluestone. 1995. Blockade of CD28/B7-1 interaction prevents epitope spreading and clinical relapses of murine EAE. Immunity. 3:739–745. - PubMed
-
- Rottman, J.B., T. Smith, J.R. Tonra, K. Ganley, T. Bloom, R. Silva, B. Pierce, J.C. Gutierrez-Ramos, E. Ozkaynak, and A.J. Coyle. 2001. The costimulatory molecule ICOS plays an important role in the immunopathogenesis of EAE. Nat. Immunol. 2:605–611. - PubMed
-
- Van Parijs, L., and A.K. Abbas. 1998. Homeostasis and self-tolerance in the immune system: turning lymphocytes off. Science. 280:243–248. - PubMed
Publication types
MeSH terms
Substances
Grants and funding
LinkOut - more resources
Full Text Sources
Other Literature Sources
Medical
Research Materials
