

Socioeconomics drive urban plant diversity
- PMID: 12847293
- PMCID: PMC166391
- DOI: 10.1073/pnas.1537557100
Socioeconomics drive urban plant diversity
Abstract
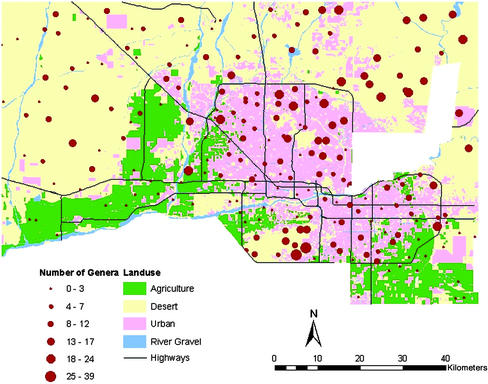
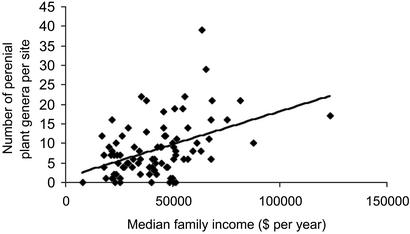
Spatial variation in plant diversity has been attributed to heterogeneity in resource availability for many ecosystems. However, urbanization has resulted in entire landscapes that are now occupied by plant communities wholly created by humans, in which diversity may reflect social, economic, and cultural influences in addition to those recognized by traditional ecological theory. Here we use data from a probability-based survey to explore the variation in plant diversity across a large metropolitan area using spatial statistical analyses that incorporate biotic, abiotic, and human variables. Our prediction for the city was that land use, along with distance from urban center, would replace the dominantly geomorphic controls on spatial variation in plant diversity in the surrounding undeveloped Sonoran desert. However, in addition to elevation and current and former land use, family income and housing age best explained the observed variation in plant diversity across the city. We conclude that a functional relationship, which we term the "luxury effect," may link human resource abundance (wealth) and plant diversity in urban ecosystems. This connection may be influenced by education, institutional control, and culture, and merits further study.
Figures
References
-
- Pickett, S. T. A., Burch, W. R., Jr., Dalton, S., Foresman, T., Grove, J. M. & Rowntree, R. (1997) Urban Ecosyst. 1, 185–199.
-
- Grimm, N. B. Grove, J. M., Pickett, S. T. A. & Redman, C. L. (2000) Bioscience 70, 571–584.
-
- Vitousek, P. M., Mooney, H. A., Lubchenco, J. & Melillo, J. M. (1997) Science 277, 494–499.
-
- McDonnell, M. J. & Pickett, S. T. A. (1993) Humans as Components of Ecosystems: The Ecology of Subtle Human Effects and Populated Areas (Springer, New York).
-
- Collins, J. P., Kinzig, A. P., Grimm, N. B., Fagan, W. B., Hope, D., Wu, J. & Borer, E. T. (2000) Am. Sci. 88, 416–425.
Publication types
MeSH terms
LinkOut - more resources
Full Text Sources
